Iranian vs Immigrants from Guatemala Median Earnings
COMPARE
Iranian
Immigrants from Guatemala
Median Earnings
Median Earnings Comparison
Iranians
Immigrants from Guatemala
$58,474
MEDIAN EARNINGS
100.0/ 100
METRIC RATING
7th/ 347
METRIC RANK
$40,851
MEDIAN EARNINGS
0.0/ 100
METRIC RATING
304th/ 347
METRIC RANK
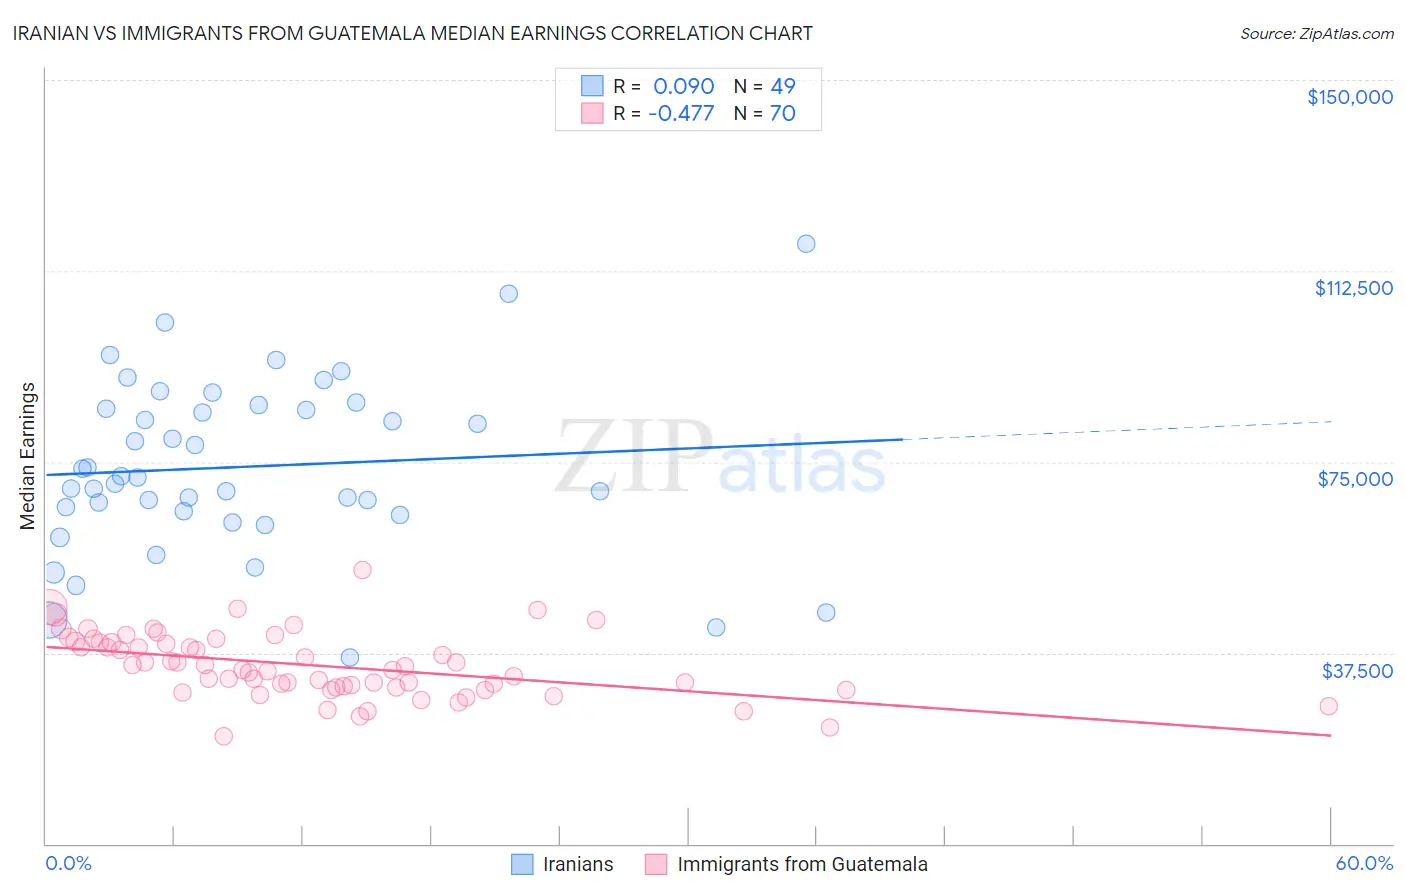
Iranian vs Immigrants from Guatemala Median Earnings Correlation Chart
The statistical analysis conducted on geographies consisting of 316,848,979 people shows a slight positive correlation between the proportion of Iranians and median earnings in the United States with a correlation coefficient (R) of 0.090 and weighted average of $58,474. Similarly, the statistical analysis conducted on geographies consisting of 377,268,152 people shows a moderate negative correlation between the proportion of Immigrants from Guatemala and median earnings in the United States with a correlation coefficient (R) of -0.477 and weighted average of $40,851, a difference of 43.1%.
Median Earnings Correlation Summary
| Measurement | Iranian | Immigrants from Guatemala |
| Minimum | $36,458 | $21,140 |
| Maximum | $117,883 | $53,713 |
| Range | $81,425 | $32,573 |
| Mean | $74,068 | $35,043 |
| Median | $72,050 | $34,514 |
| Interquartile 25% (IQ1) | $64,975 | $30,761 |
| Interquartile 75% (IQ3) | $85,806 | $39,604 |
| Interquartile Range (IQR) | $20,831 | $8,843 |
| Standard Deviation (Sample) | $17,049 | $6,256 |
| Standard Deviation (Population) | $16,874 | $6,211 |
Similar Demographics by Median Earnings
Demographics Similar to Iranians by Median Earnings
In terms of median earnings, the demographic groups most similar to Iranians are Immigrants from Singapore ($59,038, a difference of 0.97%), Thai ($59,237, a difference of 1.3%), Immigrants from Iran ($57,612, a difference of 1.5%), Okinawan ($57,550, a difference of 1.6%), and Immigrants from Hong Kong ($59,433, a difference of 1.6%).
| Demographics | Rating | Rank | Median Earnings |
| Filipinos | 100.0 /100 | #1 | Exceptional $61,197 |
| Immigrants | Taiwan | 100.0 /100 | #2 | Exceptional $61,151 |
| Immigrants | India | 100.0 /100 | #3 | Exceptional $60,648 |
| Immigrants | Hong Kong | 100.0 /100 | #4 | Exceptional $59,433 |
| Thais | 100.0 /100 | #5 | Exceptional $59,237 |
| Immigrants | Singapore | 100.0 /100 | #6 | Exceptional $59,038 |
| Iranians | 100.0 /100 | #7 | Exceptional $58,474 |
| Immigrants | Iran | 100.0 /100 | #8 | Exceptional $57,612 |
| Okinawans | 100.0 /100 | #9 | Exceptional $57,550 |
| Immigrants | South Central Asia | 100.0 /100 | #10 | Exceptional $57,114 |
| Immigrants | Israel | 100.0 /100 | #11 | Exceptional $57,034 |
| Immigrants | Ireland | 100.0 /100 | #12 | Exceptional $56,854 |
| Immigrants | China | 100.0 /100 | #13 | Exceptional $56,638 |
| Immigrants | Australia | 100.0 /100 | #14 | Exceptional $56,305 |
| Indians (Asian) | 100.0 /100 | #15 | Exceptional $56,253 |
Demographics Similar to Immigrants from Guatemala by Median Earnings
In terms of median earnings, the demographic groups most similar to Immigrants from Guatemala are Haitian ($40,918, a difference of 0.16%), Shoshone ($40,932, a difference of 0.20%), Chickasaw ($40,672, a difference of 0.44%), Immigrants from Latin America ($41,049, a difference of 0.48%), and Ute ($41,051, a difference of 0.49%).
| Demographics | Rating | Rank | Median Earnings |
| Guatemalans | 0.1 /100 | #297 | Tragic $41,205 |
| Immigrants | Micronesia | 0.1 /100 | #298 | Tragic $41,133 |
| Immigrants | Caribbean | 0.1 /100 | #299 | Tragic $41,119 |
| Ute | 0.1 /100 | #300 | Tragic $41,051 |
| Immigrants | Latin America | 0.1 /100 | #301 | Tragic $41,049 |
| Shoshone | 0.0 /100 | #302 | Tragic $40,932 |
| Haitians | 0.0 /100 | #303 | Tragic $40,918 |
| Immigrants | Guatemala | 0.0 /100 | #304 | Tragic $40,851 |
| Chickasaw | 0.0 /100 | #305 | Tragic $40,672 |
| Yaqui | 0.0 /100 | #306 | Tragic $40,647 |
| Hondurans | 0.0 /100 | #307 | Tragic $40,638 |
| Cubans | 0.0 /100 | #308 | Tragic $40,619 |
| Immigrants | Haiti | 0.0 /100 | #309 | Tragic $40,550 |
| Apache | 0.0 /100 | #310 | Tragic $40,388 |
| Hispanics or Latinos | 0.0 /100 | #311 | Tragic $40,288 |