Iranian vs Cypriot Median Earnings
COMPARE
Iranian
Cypriot
Median Earnings
Median Earnings Comparison
Iranians
Cypriots
$58,474
MEDIAN EARNINGS
100.0/ 100
METRIC RATING
7th/ 347
METRIC RANK
$54,589
MEDIAN EARNINGS
100.0/ 100
METRIC RATING
20th/ 347
METRIC RANK
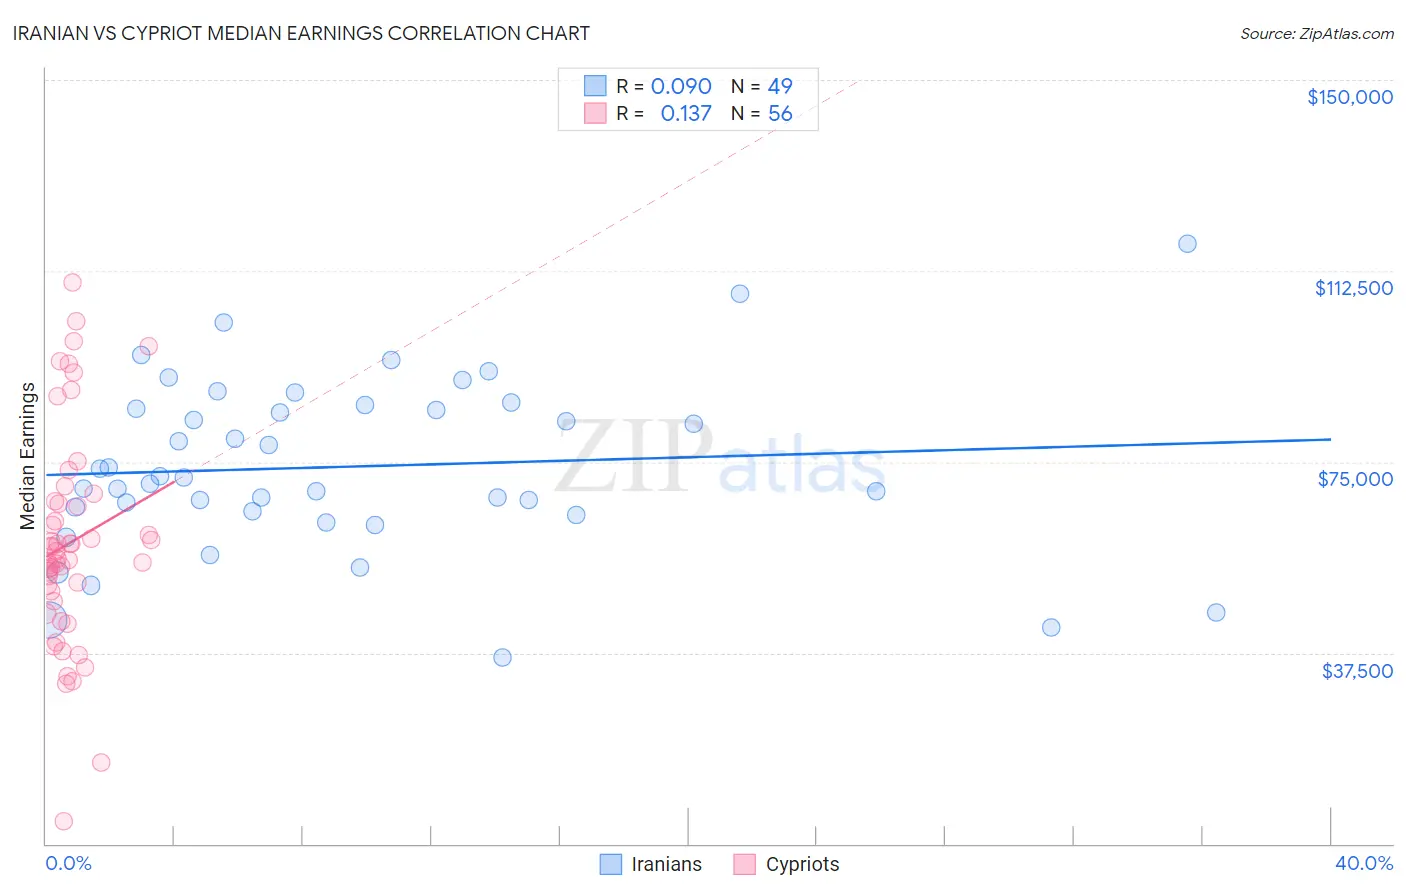
Iranian vs Cypriot Median Earnings Correlation Chart
The statistical analysis conducted on geographies consisting of 316,848,979 people shows a slight positive correlation between the proportion of Iranians and median earnings in the United States with a correlation coefficient (R) of 0.090 and weighted average of $58,474. Similarly, the statistical analysis conducted on geographies consisting of 61,853,771 people shows a poor positive correlation between the proportion of Cypriots and median earnings in the United States with a correlation coefficient (R) of 0.137 and weighted average of $54,589, a difference of 7.1%.
Median Earnings Correlation Summary
| Measurement | Iranian | Cypriot |
| Minimum | $36,458 | $4,333 |
| Maximum | $117,883 | $110,295 |
| Range | $81,425 | $105,962 |
| Mean | $74,068 | $59,088 |
| Median | $72,050 | $56,710 |
| Interquartile 25% (IQ1) | $64,975 | $48,668 |
| Interquartile 75% (IQ3) | $85,806 | $66,958 |
| Interquartile Range (IQR) | $20,831 | $18,291 |
| Standard Deviation (Sample) | $17,049 | $21,103 |
| Standard Deviation (Population) | $16,874 | $20,914 |
Demographics Similar to Iranians and Cypriots by Median Earnings
In terms of median earnings, the demographic groups most similar to Iranians are Immigrants from Singapore ($59,038, a difference of 0.97%), Thai ($59,237, a difference of 1.3%), Immigrants from Iran ($57,612, a difference of 1.5%), Okinawan ($57,550, a difference of 1.6%), and Immigrants from Hong Kong ($59,433, a difference of 1.6%). Similarly, the demographic groups most similar to Cypriots are Burmese ($54,559, a difference of 0.060%), Immigrants from Korea ($54,530, a difference of 0.11%), Immigrants from Belgium ($54,679, a difference of 0.16%), Immigrants from Sweden ($54,478, a difference of 0.20%), and Immigrants from Japan ($54,938, a difference of 0.64%).
| Demographics | Rating | Rank | Median Earnings |
| Immigrants | India | 100.0 /100 | #3 | Exceptional $60,648 |
| Immigrants | Hong Kong | 100.0 /100 | #4 | Exceptional $59,433 |
| Thais | 100.0 /100 | #5 | Exceptional $59,237 |
| Immigrants | Singapore | 100.0 /100 | #6 | Exceptional $59,038 |
| Iranians | 100.0 /100 | #7 | Exceptional $58,474 |
| Immigrants | Iran | 100.0 /100 | #8 | Exceptional $57,612 |
| Okinawans | 100.0 /100 | #9 | Exceptional $57,550 |
| Immigrants | South Central Asia | 100.0 /100 | #10 | Exceptional $57,114 |
| Immigrants | Israel | 100.0 /100 | #11 | Exceptional $57,034 |
| Immigrants | Ireland | 100.0 /100 | #12 | Exceptional $56,854 |
| Immigrants | China | 100.0 /100 | #13 | Exceptional $56,638 |
| Immigrants | Australia | 100.0 /100 | #14 | Exceptional $56,305 |
| Indians (Asian) | 100.0 /100 | #15 | Exceptional $56,253 |
| Immigrants | Eastern Asia | 100.0 /100 | #16 | Exceptional $56,183 |
| Eastern Europeans | 100.0 /100 | #17 | Exceptional $55,084 |
| Immigrants | Japan | 100.0 /100 | #18 | Exceptional $54,938 |
| Immigrants | Belgium | 100.0 /100 | #19 | Exceptional $54,679 |
| Cypriots | 100.0 /100 | #20 | Exceptional $54,589 |
| Burmese | 100.0 /100 | #21 | Exceptional $54,559 |
| Immigrants | Korea | 100.0 /100 | #22 | Exceptional $54,530 |
| Immigrants | Sweden | 100.0 /100 | #23 | Exceptional $54,478 |