Inupiat vs Ghanaian Median Earnings
COMPARE
Inupiat
Ghanaian
Median Earnings
Median Earnings Comparison
Inupiat
Ghanaians
$43,000
MEDIAN EARNINGS
0.8/ 100
METRIC RATING
263rd/ 347
METRIC RANK
$46,440
MEDIAN EARNINGS
50.3/ 100
METRIC RATING
173rd/ 347
METRIC RANK
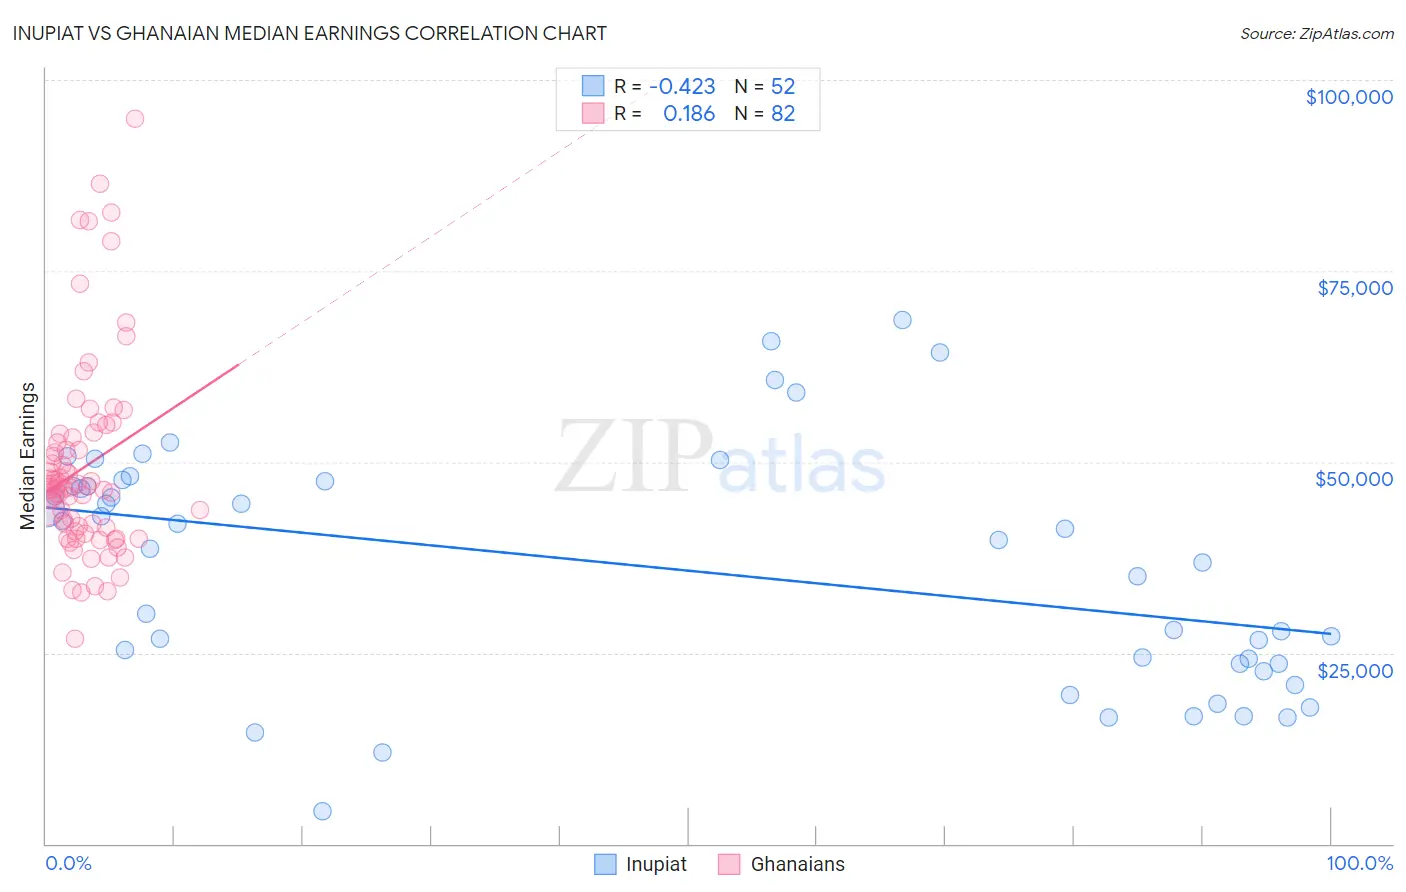
Inupiat vs Ghanaian Median Earnings Correlation Chart
The statistical analysis conducted on geographies consisting of 96,339,660 people shows a moderate negative correlation between the proportion of Inupiat and median earnings in the United States with a correlation coefficient (R) of -0.423 and weighted average of $43,000. Similarly, the statistical analysis conducted on geographies consisting of 190,721,240 people shows a poor positive correlation between the proportion of Ghanaians and median earnings in the United States with a correlation coefficient (R) of 0.186 and weighted average of $46,440, a difference of 8.0%.
Median Earnings Correlation Summary
| Measurement | Inupiat | Ghanaian |
| Minimum | $4,192 | $26,919 |
| Maximum | $68,590 | $94,961 |
| Range | $64,398 | $68,042 |
| Mean | $36,209 | $49,239 |
| Median | $39,208 | $46,600 |
| Interquartile 25% (IQ1) | $23,611 | $40,949 |
| Interquartile 75% (IQ3) | $47,170 | $53,241 |
| Interquartile Range (IQR) | $23,559 | $12,292 |
| Standard Deviation (Sample) | $15,551 | $12,902 |
| Standard Deviation (Population) | $15,401 | $12,823 |
Similar Demographics by Median Earnings
Demographics Similar to Inupiat by Median Earnings
In terms of median earnings, the demographic groups most similar to Inupiat are Immigrants from Jamaica ($43,026, a difference of 0.060%), Nicaraguan ($43,026, a difference of 0.060%), Immigrants from Liberia ($42,923, a difference of 0.18%), Salvadoran ($42,912, a difference of 0.20%), and Immigrants from Somalia ($43,100, a difference of 0.23%).
| Demographics | Rating | Rank | Median Earnings |
| Alaskan Athabascans | 1.4 /100 | #256 | Tragic $43,393 |
| Jamaicans | 1.3 /100 | #257 | Tragic $43,343 |
| French American Indians | 1.3 /100 | #258 | Tragic $43,333 |
| German Russians | 1.1 /100 | #259 | Tragic $43,200 |
| Immigrants | Somalia | 0.9 /100 | #260 | Tragic $43,100 |
| Immigrants | Jamaica | 0.8 /100 | #261 | Tragic $43,026 |
| Nicaraguans | 0.8 /100 | #262 | Tragic $43,026 |
| Inupiat | 0.8 /100 | #263 | Tragic $43,000 |
| Immigrants | Liberia | 0.7 /100 | #264 | Tragic $42,923 |
| Salvadorans | 0.7 /100 | #265 | Tragic $42,912 |
| Immigrants | Laos | 0.7 /100 | #266 | Tragic $42,884 |
| Cree | 0.6 /100 | #267 | Tragic $42,777 |
| Americans | 0.6 /100 | #268 | Tragic $42,742 |
| Belizeans | 0.5 /100 | #269 | Tragic $42,702 |
| Osage | 0.5 /100 | #270 | Tragic $42,651 |
Demographics Similar to Ghanaians by Median Earnings
In terms of median earnings, the demographic groups most similar to Ghanaians are Scandinavian ($46,433, a difference of 0.020%), Scottish ($46,463, a difference of 0.050%), Kenyan ($46,462, a difference of 0.050%), Immigrants ($46,478, a difference of 0.080%), and Basque ($46,399, a difference of 0.090%).
| Demographics | Rating | Rank | Median Earnings |
| Czechoslovakians | 57.8 /100 | #166 | Average $46,658 |
| Costa Ricans | 57.4 /100 | #167 | Average $46,645 |
| Immigrants | Africa | 54.6 /100 | #168 | Average $46,564 |
| Immigrants | South America | 54.0 /100 | #169 | Average $46,548 |
| Immigrants | Immigrants | 51.6 /100 | #170 | Average $46,478 |
| Scottish | 51.1 /100 | #171 | Average $46,463 |
| Kenyans | 51.0 /100 | #172 | Average $46,462 |
| Ghanaians | 50.3 /100 | #173 | Average $46,440 |
| Scandinavians | 50.0 /100 | #174 | Average $46,433 |
| Basques | 48.8 /100 | #175 | Average $46,399 |
| Danes | 48.6 /100 | #176 | Average $46,392 |
| Belgians | 48.0 /100 | #177 | Average $46,375 |
| Colombians | 47.1 /100 | #178 | Average $46,349 |
| English | 46.5 /100 | #179 | Average $46,334 |
| Puget Sound Salish | 46.5 /100 | #180 | Average $46,333 |