Inupiat vs Yaqui Median Earnings
COMPARE
Inupiat
Yaqui
Median Earnings
Median Earnings Comparison
Inupiat
Yaqui
$43,000
MEDIAN EARNINGS
0.8/ 100
METRIC RATING
263rd/ 347
METRIC RANK
$40,647
MEDIAN EARNINGS
0.0/ 100
METRIC RATING
306th/ 347
METRIC RANK
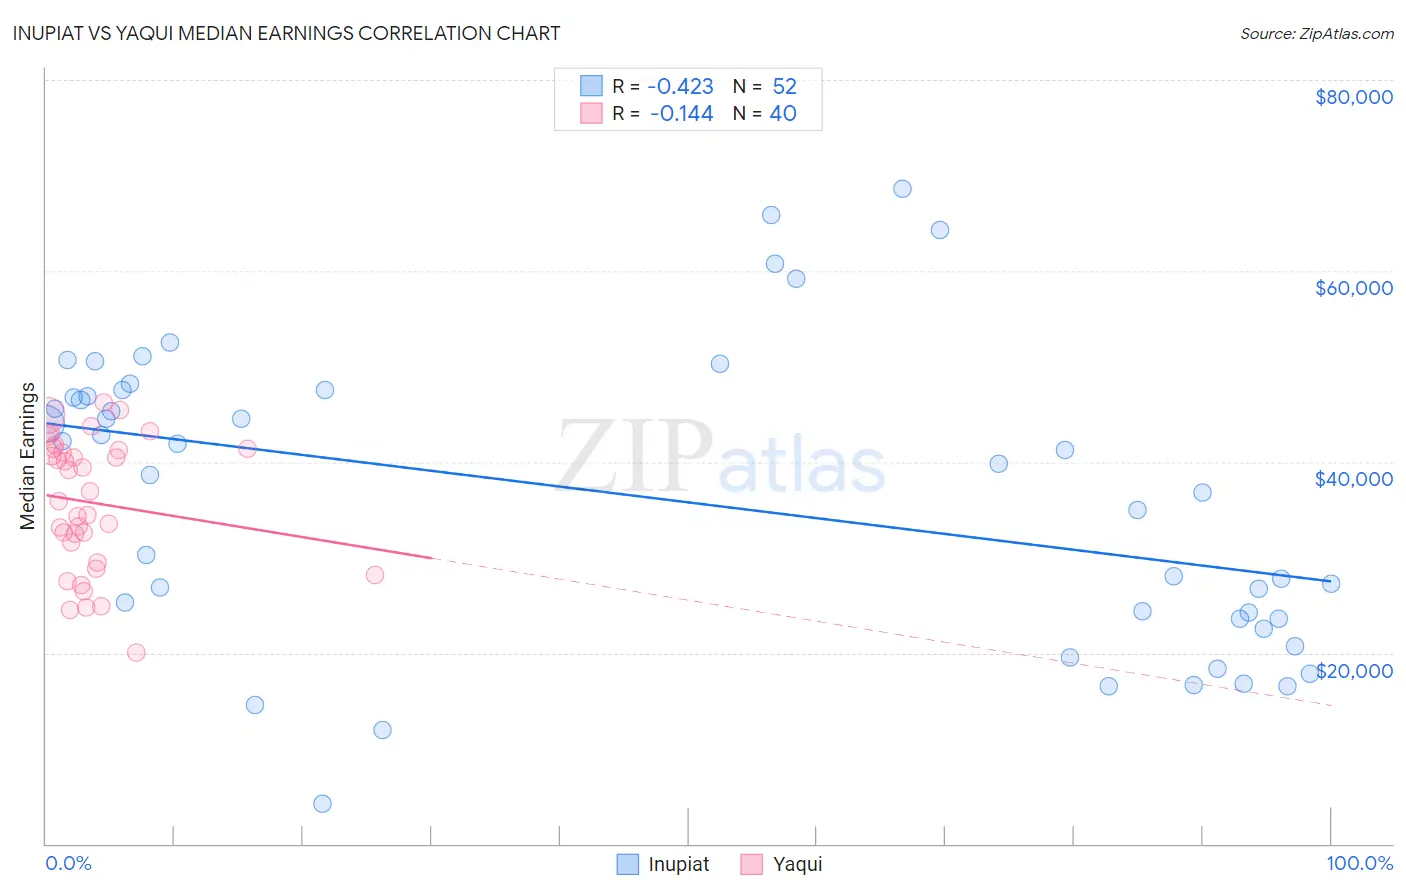
Inupiat vs Yaqui Median Earnings Correlation Chart
The statistical analysis conducted on geographies consisting of 96,339,660 people shows a moderate negative correlation between the proportion of Inupiat and median earnings in the United States with a correlation coefficient (R) of -0.423 and weighted average of $43,000. Similarly, the statistical analysis conducted on geographies consisting of 107,736,593 people shows a poor negative correlation between the proportion of Yaqui and median earnings in the United States with a correlation coefficient (R) of -0.144 and weighted average of $40,647, a difference of 5.8%.
Median Earnings Correlation Summary
| Measurement | Inupiat | Yaqui |
| Minimum | $4,192 | $20,058 |
| Maximum | $68,590 | $46,273 |
| Range | $64,398 | $26,215 |
| Mean | $36,209 | $35,713 |
| Median | $39,208 | $36,396 |
| Interquartile 25% (IQ1) | $23,611 | $30,515 |
| Interquartile 75% (IQ3) | $47,170 | $41,344 |
| Interquartile Range (IQR) | $23,559 | $10,829 |
| Standard Deviation (Sample) | $15,551 | $6,900 |
| Standard Deviation (Population) | $15,401 | $6,813 |
Similar Demographics by Median Earnings
Demographics Similar to Inupiat by Median Earnings
In terms of median earnings, the demographic groups most similar to Inupiat are Immigrants from Jamaica ($43,026, a difference of 0.060%), Nicaraguan ($43,026, a difference of 0.060%), Immigrants from Liberia ($42,923, a difference of 0.18%), Salvadoran ($42,912, a difference of 0.20%), and Immigrants from Somalia ($43,100, a difference of 0.23%).
| Demographics | Rating | Rank | Median Earnings |
| Alaskan Athabascans | 1.4 /100 | #256 | Tragic $43,393 |
| Jamaicans | 1.3 /100 | #257 | Tragic $43,343 |
| French American Indians | 1.3 /100 | #258 | Tragic $43,333 |
| German Russians | 1.1 /100 | #259 | Tragic $43,200 |
| Immigrants | Somalia | 0.9 /100 | #260 | Tragic $43,100 |
| Immigrants | Jamaica | 0.8 /100 | #261 | Tragic $43,026 |
| Nicaraguans | 0.8 /100 | #262 | Tragic $43,026 |
| Inupiat | 0.8 /100 | #263 | Tragic $43,000 |
| Immigrants | Liberia | 0.7 /100 | #264 | Tragic $42,923 |
| Salvadorans | 0.7 /100 | #265 | Tragic $42,912 |
| Immigrants | Laos | 0.7 /100 | #266 | Tragic $42,884 |
| Cree | 0.6 /100 | #267 | Tragic $42,777 |
| Americans | 0.6 /100 | #268 | Tragic $42,742 |
| Belizeans | 0.5 /100 | #269 | Tragic $42,702 |
| Osage | 0.5 /100 | #270 | Tragic $42,651 |
Demographics Similar to Yaqui by Median Earnings
In terms of median earnings, the demographic groups most similar to Yaqui are Honduran ($40,638, a difference of 0.020%), Chickasaw ($40,672, a difference of 0.060%), Cuban ($40,619, a difference of 0.070%), Immigrants from Haiti ($40,550, a difference of 0.24%), and Immigrants from Guatemala ($40,851, a difference of 0.50%).
| Demographics | Rating | Rank | Median Earnings |
| Immigrants | Caribbean | 0.1 /100 | #299 | Tragic $41,119 |
| Ute | 0.1 /100 | #300 | Tragic $41,051 |
| Immigrants | Latin America | 0.1 /100 | #301 | Tragic $41,049 |
| Shoshone | 0.0 /100 | #302 | Tragic $40,932 |
| Haitians | 0.0 /100 | #303 | Tragic $40,918 |
| Immigrants | Guatemala | 0.0 /100 | #304 | Tragic $40,851 |
| Chickasaw | 0.0 /100 | #305 | Tragic $40,672 |
| Yaqui | 0.0 /100 | #306 | Tragic $40,647 |
| Hondurans | 0.0 /100 | #307 | Tragic $40,638 |
| Cubans | 0.0 /100 | #308 | Tragic $40,619 |
| Immigrants | Haiti | 0.0 /100 | #309 | Tragic $40,550 |
| Apache | 0.0 /100 | #310 | Tragic $40,388 |
| Hispanics or Latinos | 0.0 /100 | #311 | Tragic $40,288 |
| Chippewa | 0.0 /100 | #312 | Tragic $40,287 |
| Choctaw | 0.0 /100 | #313 | Tragic $40,270 |