Inupiat vs Basque Per Capita Income
COMPARE
Inupiat
Basque
Per Capita Income
Per Capita Income Comparison
Inupiat
Basques
$36,999
PER CAPITA INCOME
0.1/ 100
METRIC RATING
305th/ 347
METRIC RANK
$45,086
PER CAPITA INCOME
83.2/ 100
METRIC RATING
139th/ 347
METRIC RANK
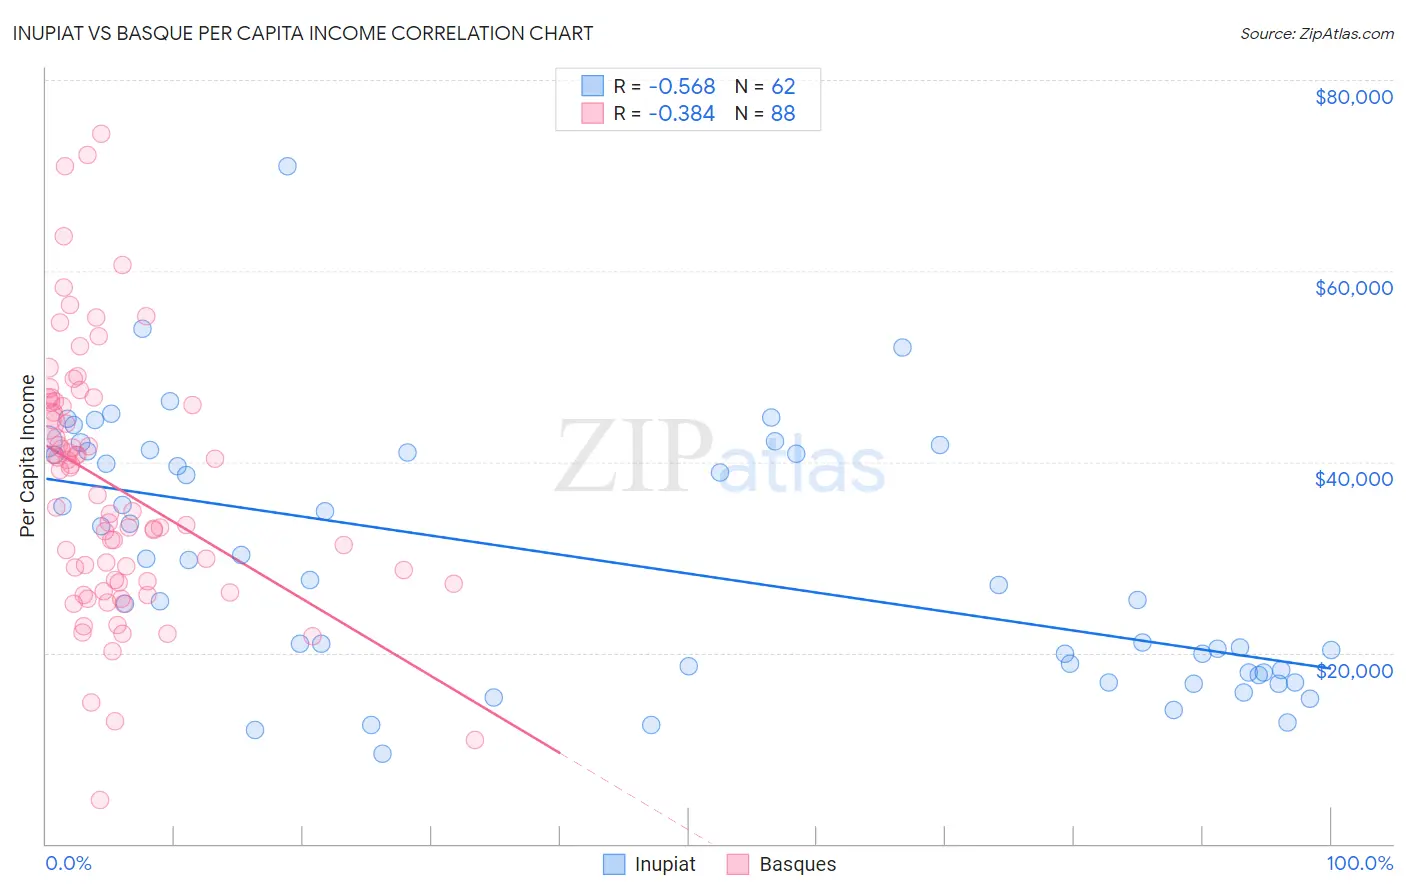
Inupiat vs Basque Per Capita Income Correlation Chart
The statistical analysis conducted on geographies consisting of 96,349,338 people shows a substantial negative correlation between the proportion of Inupiat and per capita income in the United States with a correlation coefficient (R) of -0.568 and weighted average of $36,999. Similarly, the statistical analysis conducted on geographies consisting of 165,779,827 people shows a mild negative correlation between the proportion of Basques and per capita income in the United States with a correlation coefficient (R) of -0.384 and weighted average of $45,086, a difference of 21.9%.
Per Capita Income Correlation Summary
| Measurement | Inupiat | Basque |
| Minimum | $9,481 | $4,617 |
| Maximum | $71,025 | $74,412 |
| Range | $61,544 | $69,795 |
| Mean | $29,494 | $37,448 |
| Median | $27,374 | $35,882 |
| Interquartile 25% (IQ1) | $17,924 | $27,463 |
| Interquartile 75% (IQ3) | $40,952 | $46,112 |
| Interquartile Range (IQR) | $23,028 | $18,649 |
| Standard Deviation (Sample) | $13,151 | $13,380 |
| Standard Deviation (Population) | $13,045 | $13,304 |
Similar Demographics by Per Capita Income
Demographics Similar to Inupiat by Per Capita Income
In terms of per capita income, the demographic groups most similar to Inupiat are Honduran ($37,031, a difference of 0.080%), Paiute ($37,066, a difference of 0.18%), Shoshone ($37,072, a difference of 0.20%), Ottawa ($37,101, a difference of 0.28%), and Immigrants from Haiti ($36,849, a difference of 0.41%).
| Demographics | Rating | Rank | Per Capita Income |
| Immigrants | Caribbean | 0.1 /100 | #298 | Tragic $37,254 |
| Cherokee | 0.1 /100 | #299 | Tragic $37,203 |
| Immigrants | Bahamas | 0.1 /100 | #300 | Tragic $37,193 |
| Ottawa | 0.1 /100 | #301 | Tragic $37,101 |
| Shoshone | 0.1 /100 | #302 | Tragic $37,072 |
| Paiute | 0.1 /100 | #303 | Tragic $37,066 |
| Hondurans | 0.1 /100 | #304 | Tragic $37,031 |
| Inupiat | 0.1 /100 | #305 | Tragic $36,999 |
| Immigrants | Haiti | 0.0 /100 | #306 | Tragic $36,849 |
| Immigrants | Latin America | 0.0 /100 | #307 | Tragic $36,823 |
| Fijians | 0.0 /100 | #308 | Tragic $36,690 |
| Immigrants | Honduras | 0.0 /100 | #309 | Tragic $36,665 |
| Ute | 0.0 /100 | #310 | Tragic $36,651 |
| Chippewa | 0.0 /100 | #311 | Tragic $36,631 |
| Chickasaw | 0.0 /100 | #312 | Tragic $36,475 |
Demographics Similar to Basques by Per Capita Income
In terms of per capita income, the demographic groups most similar to Basques are Immigrants from Jordan ($45,066, a difference of 0.050%), Slavic ($45,049, a difference of 0.080%), Ugandan ($45,047, a difference of 0.090%), Immigrants from Uganda ($45,043, a difference of 0.10%), and Icelander ($44,987, a difference of 0.22%).
| Demographics | Rating | Rank | Per Capita Income |
| Jordanians | 89.9 /100 | #132 | Excellent $45,605 |
| Pakistanis | 89.7 /100 | #133 | Excellent $45,587 |
| Slovenes | 89.6 /100 | #134 | Excellent $45,581 |
| Hungarians | 87.9 /100 | #135 | Excellent $45,426 |
| Immigrants | Oceania | 85.2 /100 | #136 | Excellent $45,220 |
| Immigrants | Syria | 85.2 /100 | #137 | Excellent $45,218 |
| Assyrians/Chaldeans/Syriacs | 84.8 /100 | #138 | Excellent $45,195 |
| Basques | 83.2 /100 | #139 | Excellent $45,086 |
| Immigrants | Jordan | 82.9 /100 | #140 | Excellent $45,066 |
| Slavs | 82.6 /100 | #141 | Excellent $45,049 |
| Ugandans | 82.6 /100 | #142 | Excellent $45,047 |
| Immigrants | Uganda | 82.5 /100 | #143 | Excellent $45,043 |
| Icelanders | 81.6 /100 | #144 | Excellent $44,987 |
| Immigrants | Afghanistan | 78.0 /100 | #145 | Good $44,790 |
| Irish | 75.8 /100 | #146 | Good $44,679 |