Inupiat vs Italian Per Capita Income
COMPARE
Inupiat
Italian
Per Capita Income
Per Capita Income Comparison
Inupiat
Italians
$36,999
PER CAPITA INCOME
0.1/ 100
METRIC RATING
305th/ 347
METRIC RANK
$47,574
PER CAPITA INCOME
98.8/ 100
METRIC RATING
90th/ 347
METRIC RANK
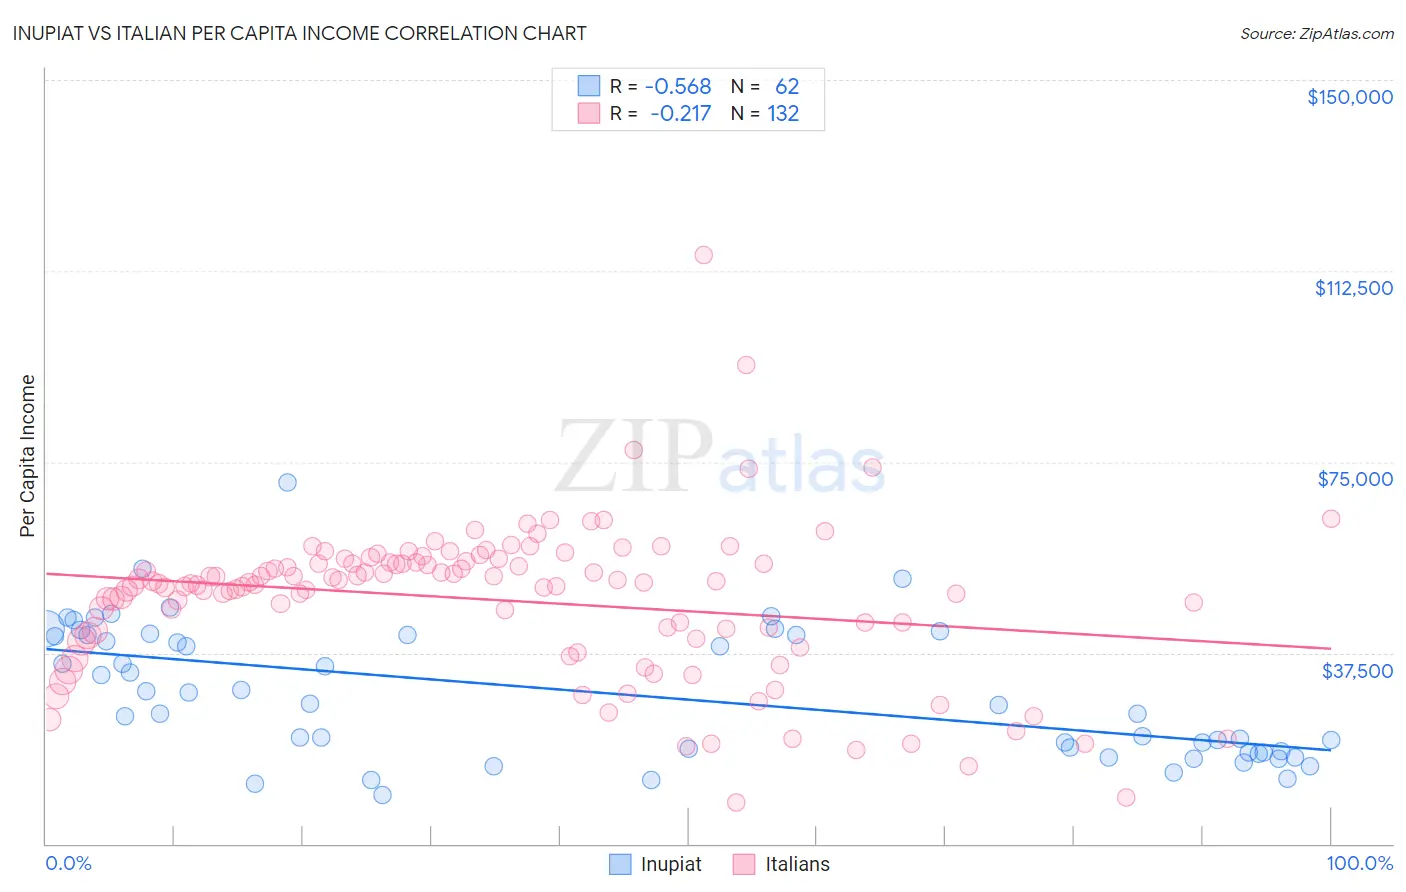
Inupiat vs Italian Per Capita Income Correlation Chart
The statistical analysis conducted on geographies consisting of 96,349,338 people shows a substantial negative correlation between the proportion of Inupiat and per capita income in the United States with a correlation coefficient (R) of -0.568 and weighted average of $36,999. Similarly, the statistical analysis conducted on geographies consisting of 575,176,397 people shows a weak negative correlation between the proportion of Italians and per capita income in the United States with a correlation coefficient (R) of -0.217 and weighted average of $47,574, a difference of 28.6%.
Per Capita Income Correlation Summary
| Measurement | Inupiat | Italian |
| Minimum | $9,481 | $7,984 |
| Maximum | $71,025 | $115,662 |
| Range | $61,544 | $107,678 |
| Mean | $29,494 | $47,928 |
| Median | $27,374 | $51,120 |
| Interquartile 25% (IQ1) | $17,924 | $41,399 |
| Interquartile 75% (IQ3) | $40,952 | $55,329 |
| Interquartile Range (IQR) | $23,028 | $13,930 |
| Standard Deviation (Sample) | $13,151 | $15,071 |
| Standard Deviation (Population) | $13,045 | $15,014 |
Similar Demographics by Per Capita Income
Demographics Similar to Inupiat by Per Capita Income
In terms of per capita income, the demographic groups most similar to Inupiat are Honduran ($37,031, a difference of 0.080%), Paiute ($37,066, a difference of 0.18%), Shoshone ($37,072, a difference of 0.20%), Ottawa ($37,101, a difference of 0.28%), and Immigrants from Haiti ($36,849, a difference of 0.41%).
| Demographics | Rating | Rank | Per Capita Income |
| Immigrants | Caribbean | 0.1 /100 | #298 | Tragic $37,254 |
| Cherokee | 0.1 /100 | #299 | Tragic $37,203 |
| Immigrants | Bahamas | 0.1 /100 | #300 | Tragic $37,193 |
| Ottawa | 0.1 /100 | #301 | Tragic $37,101 |
| Shoshone | 0.1 /100 | #302 | Tragic $37,072 |
| Paiute | 0.1 /100 | #303 | Tragic $37,066 |
| Hondurans | 0.1 /100 | #304 | Tragic $37,031 |
| Inupiat | 0.1 /100 | #305 | Tragic $36,999 |
| Immigrants | Haiti | 0.0 /100 | #306 | Tragic $36,849 |
| Immigrants | Latin America | 0.0 /100 | #307 | Tragic $36,823 |
| Fijians | 0.0 /100 | #308 | Tragic $36,690 |
| Immigrants | Honduras | 0.0 /100 | #309 | Tragic $36,665 |
| Ute | 0.0 /100 | #310 | Tragic $36,651 |
| Chippewa | 0.0 /100 | #311 | Tragic $36,631 |
| Chickasaw | 0.0 /100 | #312 | Tragic $36,475 |
Demographics Similar to Italians by Per Capita Income
In terms of per capita income, the demographic groups most similar to Italians are Macedonian ($47,573, a difference of 0.0%), Immigrants from Moldova ($47,489, a difference of 0.18%), Northern European ($47,698, a difference of 0.26%), Croatian ($47,742, a difference of 0.35%), and Immigrants from Zimbabwe ($47,394, a difference of 0.38%).
| Demographics | Rating | Rank | Per Capita Income |
| Immigrants | Brazil | 99.4 /100 | #83 | Exceptional $48,164 |
| Immigrants | Ukraine | 99.3 /100 | #84 | Exceptional $48,134 |
| Austrians | 99.3 /100 | #85 | Exceptional $48,116 |
| Immigrants | Southern Europe | 99.3 /100 | #86 | Exceptional $48,027 |
| Ukrainians | 99.3 /100 | #87 | Exceptional $48,014 |
| Croatians | 99.0 /100 | #88 | Exceptional $47,742 |
| Northern Europeans | 98.9 /100 | #89 | Exceptional $47,698 |
| Italians | 98.8 /100 | #90 | Exceptional $47,574 |
| Macedonians | 98.8 /100 | #91 | Exceptional $47,573 |
| Immigrants | Moldova | 98.7 /100 | #92 | Exceptional $47,489 |
| Immigrants | Zimbabwe | 98.5 /100 | #93 | Exceptional $47,394 |
| Albanians | 98.5 /100 | #94 | Exceptional $47,379 |
| Immigrants | Egypt | 98.5 /100 | #95 | Exceptional $47,361 |
| Alsatians | 98.3 /100 | #96 | Exceptional $47,284 |
| Carpatho Rusyns | 98.2 /100 | #97 | Exceptional $47,248 |