Inupiat vs Immigrants from Switzerland Per Capita Income
COMPARE
Inupiat
Immigrants from Switzerland
Per Capita Income
Per Capita Income Comparison
Inupiat
Immigrants from Switzerland
$36,999
PER CAPITA INCOME
0.1/ 100
METRIC RATING
305th/ 347
METRIC RANK
$54,866
PER CAPITA INCOME
100.0/ 100
METRIC RATING
16th/ 347
METRIC RANK
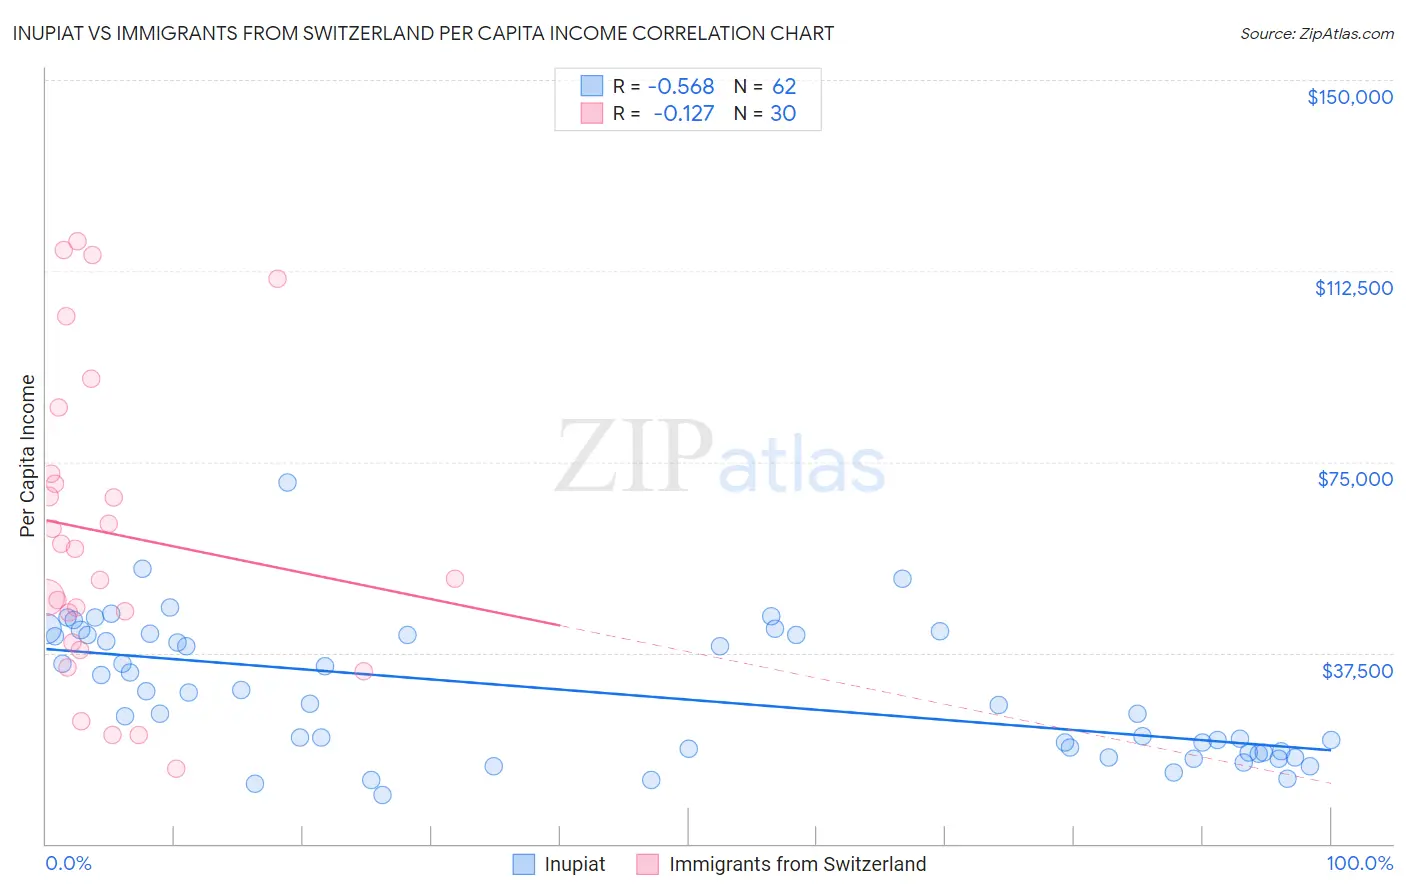
Inupiat vs Immigrants from Switzerland Per Capita Income Correlation Chart
The statistical analysis conducted on geographies consisting of 96,349,338 people shows a substantial negative correlation between the proportion of Inupiat and per capita income in the United States with a correlation coefficient (R) of -0.568 and weighted average of $36,999. Similarly, the statistical analysis conducted on geographies consisting of 148,083,583 people shows a poor negative correlation between the proportion of Immigrants from Switzerland and per capita income in the United States with a correlation coefficient (R) of -0.127 and weighted average of $54,866, a difference of 48.3%.
Per Capita Income Correlation Summary
| Measurement | Inupiat | Immigrants from Switzerland |
| Minimum | $9,481 | $14,801 |
| Maximum | $71,025 | $118,438 |
| Range | $61,544 | $103,637 |
| Mean | $29,494 | $60,936 |
| Median | $27,374 | $54,944 |
| Interquartile 25% (IQ1) | $17,924 | $39,569 |
| Interquartile 75% (IQ3) | $40,952 | $72,692 |
| Interquartile Range (IQR) | $23,028 | $33,123 |
| Standard Deviation (Sample) | $13,151 | $29,867 |
| Standard Deviation (Population) | $13,045 | $29,365 |
Similar Demographics by Per Capita Income
Demographics Similar to Inupiat by Per Capita Income
In terms of per capita income, the demographic groups most similar to Inupiat are Honduran ($37,031, a difference of 0.080%), Paiute ($37,066, a difference of 0.18%), Shoshone ($37,072, a difference of 0.20%), Ottawa ($37,101, a difference of 0.28%), and Immigrants from Haiti ($36,849, a difference of 0.41%).
| Demographics | Rating | Rank | Per Capita Income |
| Immigrants | Caribbean | 0.1 /100 | #298 | Tragic $37,254 |
| Cherokee | 0.1 /100 | #299 | Tragic $37,203 |
| Immigrants | Bahamas | 0.1 /100 | #300 | Tragic $37,193 |
| Ottawa | 0.1 /100 | #301 | Tragic $37,101 |
| Shoshone | 0.1 /100 | #302 | Tragic $37,072 |
| Paiute | 0.1 /100 | #303 | Tragic $37,066 |
| Hondurans | 0.1 /100 | #304 | Tragic $37,031 |
| Inupiat | 0.1 /100 | #305 | Tragic $36,999 |
| Immigrants | Haiti | 0.0 /100 | #306 | Tragic $36,849 |
| Immigrants | Latin America | 0.0 /100 | #307 | Tragic $36,823 |
| Fijians | 0.0 /100 | #308 | Tragic $36,690 |
| Immigrants | Honduras | 0.0 /100 | #309 | Tragic $36,665 |
| Ute | 0.0 /100 | #310 | Tragic $36,651 |
| Chippewa | 0.0 /100 | #311 | Tragic $36,631 |
| Chickasaw | 0.0 /100 | #312 | Tragic $36,475 |
Demographics Similar to Immigrants from Switzerland by Per Capita Income
In terms of per capita income, the demographic groups most similar to Immigrants from Switzerland are Cypriot ($54,899, a difference of 0.060%), Immigrants from Belgium ($55,082, a difference of 0.39%), Immigrants from France ($54,557, a difference of 0.57%), Immigrants from India ($55,268, a difference of 0.73%), and Thai ($54,307, a difference of 1.0%).
| Demographics | Rating | Rank | Per Capita Income |
| Immigrants | Ireland | 100.0 /100 | #9 | Exceptional $56,584 |
| Okinawans | 100.0 /100 | #10 | Exceptional $55,817 |
| Eastern Europeans | 100.0 /100 | #11 | Exceptional $55,780 |
| Immigrants | Sweden | 100.0 /100 | #12 | Exceptional $55,582 |
| Immigrants | India | 100.0 /100 | #13 | Exceptional $55,268 |
| Immigrants | Belgium | 100.0 /100 | #14 | Exceptional $55,082 |
| Cypriots | 100.0 /100 | #15 | Exceptional $54,899 |
| Immigrants | Switzerland | 100.0 /100 | #16 | Exceptional $54,866 |
| Immigrants | France | 100.0 /100 | #17 | Exceptional $54,557 |
| Thais | 100.0 /100 | #18 | Exceptional $54,307 |
| Immigrants | China | 100.0 /100 | #19 | Exceptional $54,264 |
| Soviet Union | 100.0 /100 | #20 | Exceptional $54,202 |
| Immigrants | Northern Europe | 100.0 /100 | #21 | Exceptional $54,159 |
| Indians (Asian) | 100.0 /100 | #22 | Exceptional $53,874 |
| Immigrants | Eastern Asia | 100.0 /100 | #23 | Exceptional $53,806 |