Inupiat vs Immigrants from Central America Per Capita Income
COMPARE
Inupiat
Immigrants from Central America
Per Capita Income
Per Capita Income Comparison
Inupiat
Immigrants from Central America
$36,999
PER CAPITA INCOME
0.1/ 100
METRIC RATING
305th/ 347
METRIC RANK
$34,974
PER CAPITA INCOME
0.0/ 100
METRIC RATING
325th/ 347
METRIC RANK
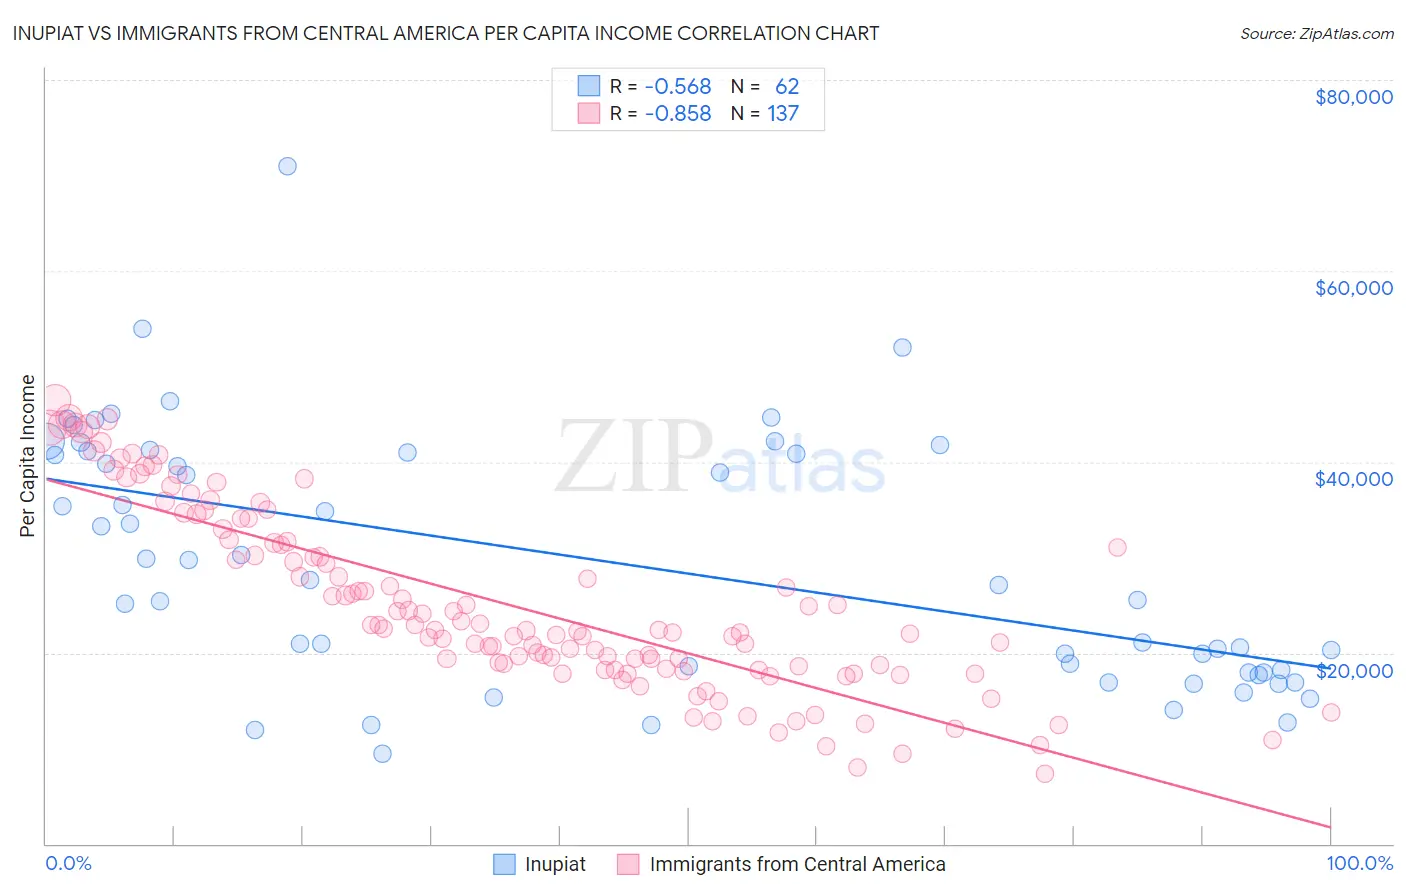
Inupiat vs Immigrants from Central America Per Capita Income Correlation Chart
The statistical analysis conducted on geographies consisting of 96,349,338 people shows a substantial negative correlation between the proportion of Inupiat and per capita income in the United States with a correlation coefficient (R) of -0.568 and weighted average of $36,999. Similarly, the statistical analysis conducted on geographies consisting of 536,571,616 people shows a very strong negative correlation between the proportion of Immigrants from Central America and per capita income in the United States with a correlation coefficient (R) of -0.858 and weighted average of $34,974, a difference of 5.8%.
Per Capita Income Correlation Summary
| Measurement | Inupiat | Immigrants from Central America |
| Minimum | $9,481 | $7,365 |
| Maximum | $71,025 | $46,418 |
| Range | $61,544 | $39,053 |
| Mean | $29,494 | $25,175 |
| Median | $27,374 | $22,366 |
| Interquartile 25% (IQ1) | $17,924 | $18,495 |
| Interquartile 75% (IQ3) | $40,952 | $31,763 |
| Interquartile Range (IQR) | $23,028 | $13,268 |
| Standard Deviation (Sample) | $13,151 | $9,475 |
| Standard Deviation (Population) | $13,045 | $9,440 |
Demographics Similar to Inupiat and Immigrants from Central America by Per Capita Income
In terms of per capita income, the demographic groups most similar to Inupiat are Immigrants from Haiti ($36,849, a difference of 0.41%), Immigrants from Latin America ($36,823, a difference of 0.48%), Fijian ($36,690, a difference of 0.84%), Immigrants from Honduras ($36,665, a difference of 0.91%), and Ute ($36,651, a difference of 0.95%). Similarly, the demographic groups most similar to Immigrants from Central America are Kiowa ($35,102, a difference of 0.37%), Cheyenne ($35,276, a difference of 0.87%), Creek ($35,546, a difference of 1.6%), Black/African American ($35,564, a difference of 1.7%), and Hispanic or Latino ($35,688, a difference of 2.0%).
| Demographics | Rating | Rank | Per Capita Income |
| Inupiat | 0.1 /100 | #305 | Tragic $36,999 |
| Immigrants | Haiti | 0.0 /100 | #306 | Tragic $36,849 |
| Immigrants | Latin America | 0.0 /100 | #307 | Tragic $36,823 |
| Fijians | 0.0 /100 | #308 | Tragic $36,690 |
| Immigrants | Honduras | 0.0 /100 | #309 | Tragic $36,665 |
| Ute | 0.0 /100 | #310 | Tragic $36,651 |
| Chippewa | 0.0 /100 | #311 | Tragic $36,631 |
| Chickasaw | 0.0 /100 | #312 | Tragic $36,475 |
| Bahamians | 0.0 /100 | #313 | Tragic $36,427 |
| Seminole | 0.0 /100 | #314 | Tragic $36,180 |
| Yaqui | 0.0 /100 | #315 | Tragic $36,112 |
| Choctaw | 0.0 /100 | #316 | Tragic $35,999 |
| Dutch West Indians | 0.0 /100 | #317 | Tragic $35,922 |
| Bangladeshis | 0.0 /100 | #318 | Tragic $35,897 |
| Immigrants | Congo | 0.0 /100 | #319 | Tragic $35,720 |
| Hispanics or Latinos | 0.0 /100 | #320 | Tragic $35,688 |
| Blacks/African Americans | 0.0 /100 | #321 | Tragic $35,564 |
| Creek | 0.0 /100 | #322 | Tragic $35,546 |
| Cheyenne | 0.0 /100 | #323 | Tragic $35,276 |
| Kiowa | 0.0 /100 | #324 | Tragic $35,102 |
| Immigrants | Central America | 0.0 /100 | #325 | Tragic $34,974 |