Inupiat vs Immigrants from Spain Per Capita Income
COMPARE
Inupiat
Immigrants from Spain
Per Capita Income
Per Capita Income Comparison
Inupiat
Immigrants from Spain
$36,999
PER CAPITA INCOME
0.1/ 100
METRIC RATING
305th/ 347
METRIC RANK
$50,933
PER CAPITA INCOME
100.0/ 100
METRIC RATING
45th/ 347
METRIC RANK
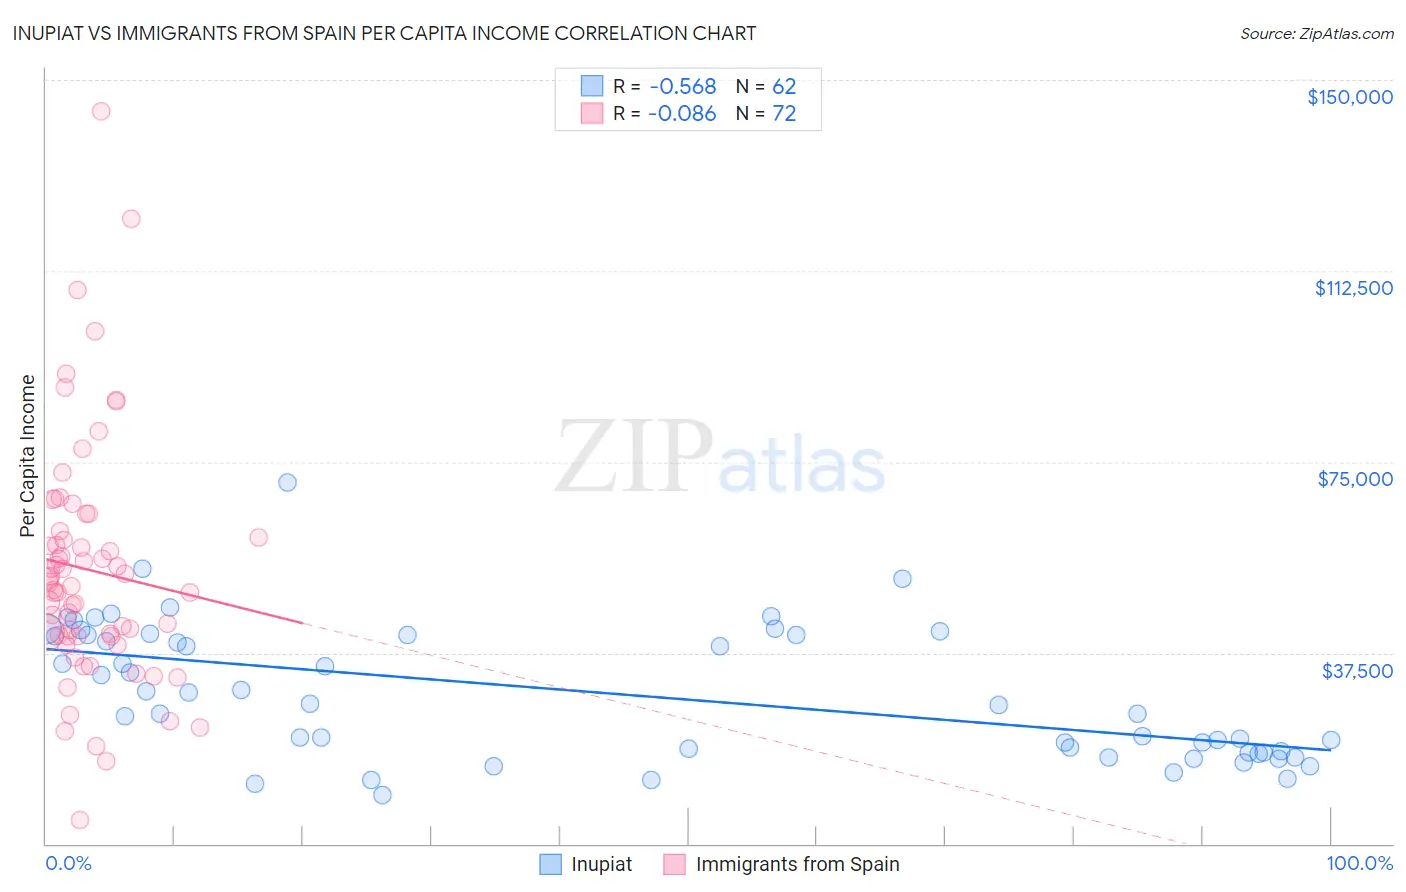
Inupiat vs Immigrants from Spain Per Capita Income Correlation Chart
The statistical analysis conducted on geographies consisting of 96,349,338 people shows a substantial negative correlation between the proportion of Inupiat and per capita income in the United States with a correlation coefficient (R) of -0.568 and weighted average of $36,999. Similarly, the statistical analysis conducted on geographies consisting of 239,686,141 people shows a slight negative correlation between the proportion of Immigrants from Spain and per capita income in the United States with a correlation coefficient (R) of -0.086 and weighted average of $50,933, a difference of 37.7%.
Per Capita Income Correlation Summary
| Measurement | Inupiat | Immigrants from Spain |
| Minimum | $9,481 | $4,617 |
| Maximum | $71,025 | $143,860 |
| Range | $61,544 | $139,243 |
| Mean | $29,494 | $53,783 |
| Median | $27,374 | $50,941 |
| Interquartile 25% (IQ1) | $17,924 | $40,770 |
| Interquartile 75% (IQ3) | $40,952 | $60,698 |
| Interquartile Range (IQR) | $23,028 | $19,928 |
| Standard Deviation (Sample) | $13,151 | $23,693 |
| Standard Deviation (Population) | $13,045 | $23,528 |
Similar Demographics by Per Capita Income
Demographics Similar to Inupiat by Per Capita Income
In terms of per capita income, the demographic groups most similar to Inupiat are Honduran ($37,031, a difference of 0.080%), Paiute ($37,066, a difference of 0.18%), Shoshone ($37,072, a difference of 0.20%), Ottawa ($37,101, a difference of 0.28%), and Immigrants from Haiti ($36,849, a difference of 0.41%).
| Demographics | Rating | Rank | Per Capita Income |
| Immigrants | Caribbean | 0.1 /100 | #298 | Tragic $37,254 |
| Cherokee | 0.1 /100 | #299 | Tragic $37,203 |
| Immigrants | Bahamas | 0.1 /100 | #300 | Tragic $37,193 |
| Ottawa | 0.1 /100 | #301 | Tragic $37,101 |
| Shoshone | 0.1 /100 | #302 | Tragic $37,072 |
| Paiute | 0.1 /100 | #303 | Tragic $37,066 |
| Hondurans | 0.1 /100 | #304 | Tragic $37,031 |
| Inupiat | 0.1 /100 | #305 | Tragic $36,999 |
| Immigrants | Haiti | 0.0 /100 | #306 | Tragic $36,849 |
| Immigrants | Latin America | 0.0 /100 | #307 | Tragic $36,823 |
| Fijians | 0.0 /100 | #308 | Tragic $36,690 |
| Immigrants | Honduras | 0.0 /100 | #309 | Tragic $36,665 |
| Ute | 0.0 /100 | #310 | Tragic $36,651 |
| Chippewa | 0.0 /100 | #311 | Tragic $36,631 |
| Chickasaw | 0.0 /100 | #312 | Tragic $36,475 |
Demographics Similar to Immigrants from Spain by Per Capita Income
In terms of per capita income, the demographic groups most similar to Immigrants from Spain are Immigrants from Europe ($50,950, a difference of 0.030%), Immigrants from Latvia ($50,914, a difference of 0.040%), Bulgarian ($50,906, a difference of 0.050%), Immigrants from Serbia ($50,810, a difference of 0.24%), and New Zealander ($50,575, a difference of 0.71%).
| Demographics | Rating | Rank | Per Capita Income |
| Immigrants | Czechoslovakia | 100.0 /100 | #38 | Exceptional $51,770 |
| Cambodians | 100.0 /100 | #39 | Exceptional $51,731 |
| Immigrants | Korea | 100.0 /100 | #40 | Exceptional $51,671 |
| Immigrants | South Africa | 100.0 /100 | #41 | Exceptional $51,465 |
| Immigrants | Turkey | 100.0 /100 | #42 | Exceptional $51,368 |
| Immigrants | Lithuania | 100.0 /100 | #43 | Exceptional $51,361 |
| Immigrants | Europe | 100.0 /100 | #44 | Exceptional $50,950 |
| Immigrants | Spain | 100.0 /100 | #45 | Exceptional $50,933 |
| Immigrants | Latvia | 100.0 /100 | #46 | Exceptional $50,914 |
| Bulgarians | 100.0 /100 | #47 | Exceptional $50,906 |
| Immigrants | Serbia | 100.0 /100 | #48 | Exceptional $50,810 |
| New Zealanders | 100.0 /100 | #49 | Exceptional $50,575 |
| Immigrants | Sri Lanka | 100.0 /100 | #50 | Exceptional $50,555 |
| Immigrants | Netherlands | 100.0 /100 | #51 | Exceptional $50,458 |
| Immigrants | Croatia | 99.9 /100 | #52 | Exceptional $50,417 |