Inupiat vs Immigrants from El Salvador Per Capita Income
COMPARE
Inupiat
Immigrants from El Salvador
Per Capita Income
Per Capita Income Comparison
Inupiat
Immigrants from El Salvador
$36,999
PER CAPITA INCOME
0.1/ 100
METRIC RATING
305th/ 347
METRIC RANK
$38,394
PER CAPITA INCOME
0.3/ 100
METRIC RATING
274th/ 347
METRIC RANK
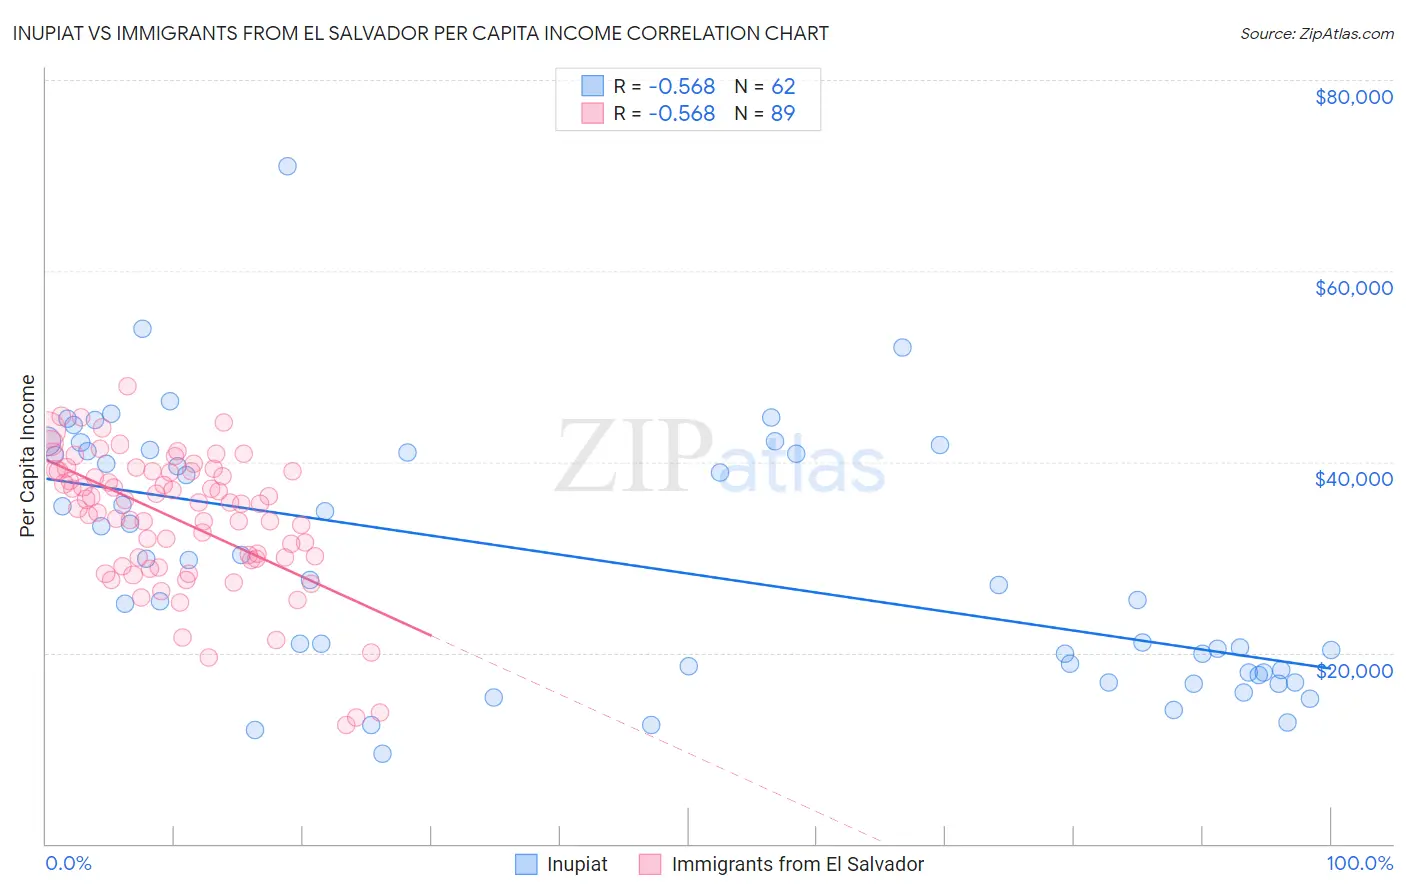
Inupiat vs Immigrants from El Salvador Per Capita Income Correlation Chart
The statistical analysis conducted on geographies consisting of 96,349,338 people shows a substantial negative correlation between the proportion of Inupiat and per capita income in the United States with a correlation coefficient (R) of -0.568 and weighted average of $36,999. Similarly, the statistical analysis conducted on geographies consisting of 357,847,435 people shows a substantial negative correlation between the proportion of Immigrants from El Salvador and per capita income in the United States with a correlation coefficient (R) of -0.568 and weighted average of $38,394, a difference of 3.8%.
Per Capita Income Correlation Summary
| Measurement | Inupiat | Immigrants from El Salvador |
| Minimum | $9,481 | $12,473 |
| Maximum | $71,025 | $47,918 |
| Range | $61,544 | $35,445 |
| Mean | $29,494 | $33,959 |
| Median | $27,374 | $35,640 |
| Interquartile 25% (IQ1) | $17,924 | $29,770 |
| Interquartile 75% (IQ3) | $40,952 | $39,011 |
| Interquartile Range (IQR) | $23,028 | $9,240 |
| Standard Deviation (Sample) | $13,151 | $7,077 |
| Standard Deviation (Population) | $13,045 | $7,037 |
Similar Demographics by Per Capita Income
Demographics Similar to Inupiat by Per Capita Income
In terms of per capita income, the demographic groups most similar to Inupiat are Honduran ($37,031, a difference of 0.080%), Paiute ($37,066, a difference of 0.18%), Shoshone ($37,072, a difference of 0.20%), Ottawa ($37,101, a difference of 0.28%), and Immigrants from Haiti ($36,849, a difference of 0.41%).
| Demographics | Rating | Rank | Per Capita Income |
| Immigrants | Caribbean | 0.1 /100 | #298 | Tragic $37,254 |
| Cherokee | 0.1 /100 | #299 | Tragic $37,203 |
| Immigrants | Bahamas | 0.1 /100 | #300 | Tragic $37,193 |
| Ottawa | 0.1 /100 | #301 | Tragic $37,101 |
| Shoshone | 0.1 /100 | #302 | Tragic $37,072 |
| Paiute | 0.1 /100 | #303 | Tragic $37,066 |
| Hondurans | 0.1 /100 | #304 | Tragic $37,031 |
| Inupiat | 0.1 /100 | #305 | Tragic $36,999 |
| Immigrants | Haiti | 0.0 /100 | #306 | Tragic $36,849 |
| Immigrants | Latin America | 0.0 /100 | #307 | Tragic $36,823 |
| Fijians | 0.0 /100 | #308 | Tragic $36,690 |
| Immigrants | Honduras | 0.0 /100 | #309 | Tragic $36,665 |
| Ute | 0.0 /100 | #310 | Tragic $36,651 |
| Chippewa | 0.0 /100 | #311 | Tragic $36,631 |
| Chickasaw | 0.0 /100 | #312 | Tragic $36,475 |
Demographics Similar to Immigrants from El Salvador by Per Capita Income
In terms of per capita income, the demographic groups most similar to Immigrants from El Salvador are Nepalese ($38,442, a difference of 0.13%), Immigrants from Cabo Verde ($38,540, a difference of 0.38%), Central American ($38,560, a difference of 0.43%), Immigrants from Belize ($38,614, a difference of 0.57%), and Immigrants from Liberia ($38,165, a difference of 0.60%).
| Demographics | Rating | Rank | Per Capita Income |
| Immigrants | Zaire | 0.4 /100 | #267 | Tragic $38,848 |
| Liberians | 0.4 /100 | #268 | Tragic $38,780 |
| Immigrants | Jamaica | 0.4 /100 | #269 | Tragic $38,766 |
| Immigrants | Belize | 0.3 /100 | #270 | Tragic $38,614 |
| Central Americans | 0.3 /100 | #271 | Tragic $38,560 |
| Immigrants | Cabo Verde | 0.3 /100 | #272 | Tragic $38,540 |
| Nepalese | 0.3 /100 | #273 | Tragic $38,442 |
| Immigrants | El Salvador | 0.3 /100 | #274 | Tragic $38,394 |
| Immigrants | Liberia | 0.2 /100 | #275 | Tragic $38,165 |
| Hmong | 0.2 /100 | #276 | Tragic $38,120 |
| Comanche | 0.2 /100 | #277 | Tragic $38,088 |
| Immigrants | Nicaragua | 0.2 /100 | #278 | Tragic $38,065 |
| Colville | 0.2 /100 | #279 | Tragic $38,047 |
| Potawatomi | 0.2 /100 | #280 | Tragic $38,046 |
| Immigrants | Dominica | 0.2 /100 | #281 | Tragic $37,952 |