Immigrants from Eastern Africa vs Basque Per Capita Income
COMPARE
Immigrants from Eastern Africa
Basque
Per Capita Income
Per Capita Income Comparison
Immigrants from Eastern Africa
Basques
$43,838
PER CAPITA INCOME
54.9/ 100
METRIC RATING
171st/ 347
METRIC RANK
$45,086
PER CAPITA INCOME
83.2/ 100
METRIC RATING
139th/ 347
METRIC RANK
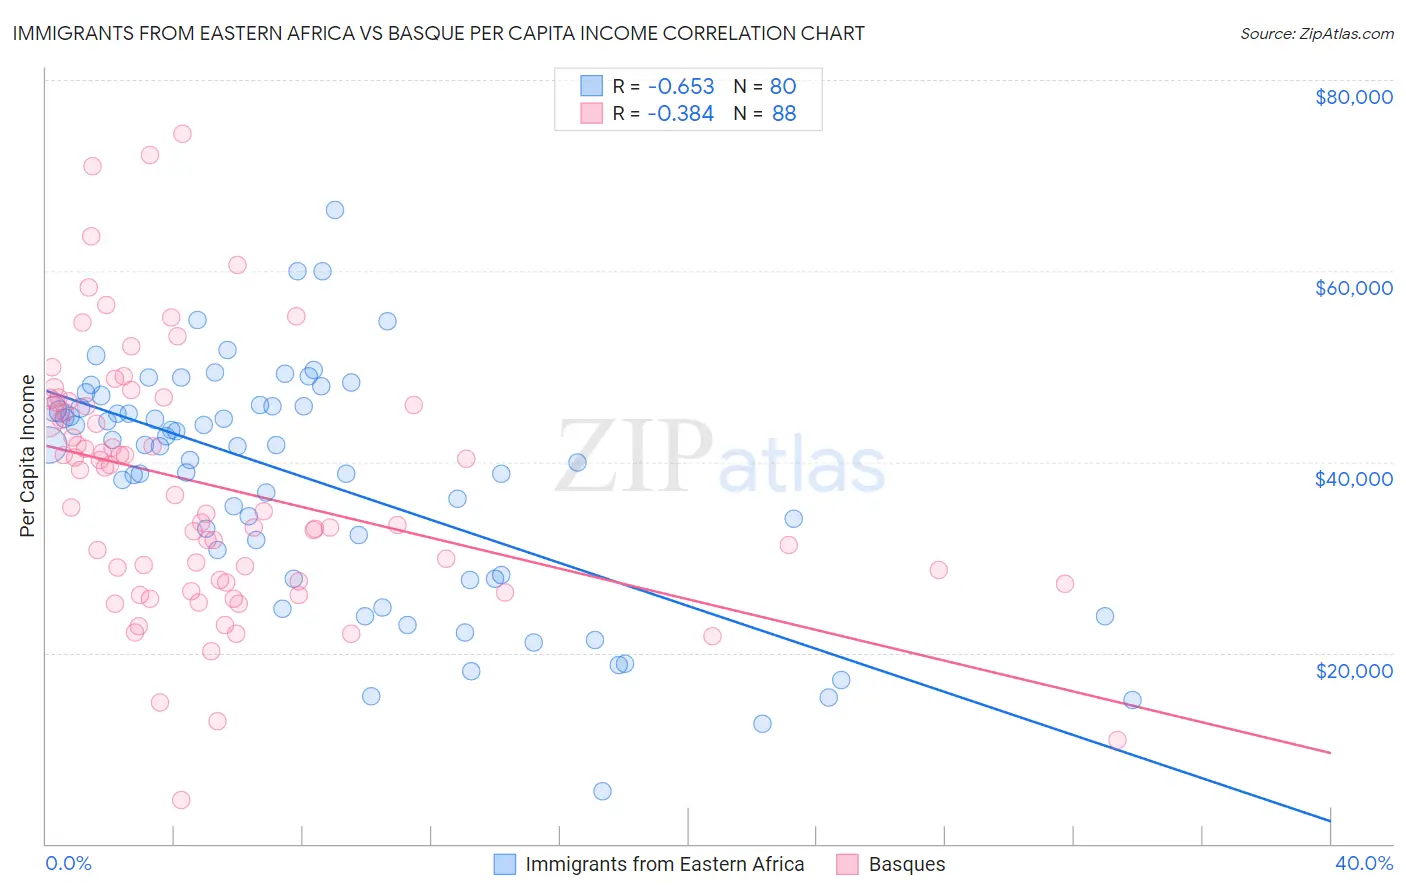
Immigrants from Eastern Africa vs Basque Per Capita Income Correlation Chart
The statistical analysis conducted on geographies consisting of 355,180,716 people shows a significant negative correlation between the proportion of Immigrants from Eastern Africa and per capita income in the United States with a correlation coefficient (R) of -0.653 and weighted average of $43,838. Similarly, the statistical analysis conducted on geographies consisting of 165,779,827 people shows a mild negative correlation between the proportion of Basques and per capita income in the United States with a correlation coefficient (R) of -0.384 and weighted average of $45,086, a difference of 2.9%.
Per Capita Income Correlation Summary
| Measurement | Immigrants from Eastern Africa | Basque |
| Minimum | $5,516 | $4,617 |
| Maximum | $66,352 | $74,412 |
| Range | $60,836 | $69,795 |
| Mean | $37,946 | $37,448 |
| Median | $41,723 | $35,882 |
| Interquartile 25% (IQ1) | $27,967 | $27,463 |
| Interquartile 75% (IQ3) | $45,811 | $46,112 |
| Interquartile Range (IQR) | $17,844 | $18,649 |
| Standard Deviation (Sample) | $12,344 | $13,380 |
| Standard Deviation (Population) | $12,266 | $13,304 |
Similar Demographics by Per Capita Income
Demographics Similar to Immigrants from Eastern Africa by Per Capita Income
In terms of per capita income, the demographic groups most similar to Immigrants from Eastern Africa are Scandinavian ($43,848, a difference of 0.020%), Immigrants from Peru ($43,852, a difference of 0.030%), Czechoslovakian ($43,806, a difference of 0.070%), Belgian ($43,951, a difference of 0.26%), and English ($43,982, a difference of 0.33%).
| Demographics | Rating | Rank | Per Capita Income |
| Sri Lankans | 59.8 /100 | #164 | Average $44,014 |
| Immigrants | Philippines | 59.4 /100 | #165 | Average $44,000 |
| Immigrants | Uruguay | 59.3 /100 | #166 | Average $43,997 |
| English | 58.9 /100 | #167 | Average $43,982 |
| Belgians | 58.1 /100 | #168 | Average $43,951 |
| Immigrants | Peru | 55.3 /100 | #169 | Average $43,852 |
| Scandinavians | 55.2 /100 | #170 | Average $43,848 |
| Immigrants | Eastern Africa | 54.9 /100 | #171 | Average $43,838 |
| Czechoslovakians | 54.1 /100 | #172 | Average $43,806 |
| French | 50.7 /100 | #173 | Average $43,685 |
| Colombians | 50.0 /100 | #174 | Average $43,661 |
| Celtics | 48.9 /100 | #175 | Average $43,621 |
| Immigrants | South Eastern Asia | 46.6 /100 | #176 | Average $43,539 |
| Tlingit-Haida | 45.9 /100 | #177 | Average $43,516 |
| Immigrants | Costa Rica | 44.5 /100 | #178 | Average $43,464 |
Demographics Similar to Basques by Per Capita Income
In terms of per capita income, the demographic groups most similar to Basques are Immigrants from Jordan ($45,066, a difference of 0.050%), Slavic ($45,049, a difference of 0.080%), Ugandan ($45,047, a difference of 0.090%), Immigrants from Uganda ($45,043, a difference of 0.10%), and Icelander ($44,987, a difference of 0.22%).
| Demographics | Rating | Rank | Per Capita Income |
| Jordanians | 89.9 /100 | #132 | Excellent $45,605 |
| Pakistanis | 89.7 /100 | #133 | Excellent $45,587 |
| Slovenes | 89.6 /100 | #134 | Excellent $45,581 |
| Hungarians | 87.9 /100 | #135 | Excellent $45,426 |
| Immigrants | Oceania | 85.2 /100 | #136 | Excellent $45,220 |
| Immigrants | Syria | 85.2 /100 | #137 | Excellent $45,218 |
| Assyrians/Chaldeans/Syriacs | 84.8 /100 | #138 | Excellent $45,195 |
| Basques | 83.2 /100 | #139 | Excellent $45,086 |
| Immigrants | Jordan | 82.9 /100 | #140 | Excellent $45,066 |
| Slavs | 82.6 /100 | #141 | Excellent $45,049 |
| Ugandans | 82.6 /100 | #142 | Excellent $45,047 |
| Immigrants | Uganda | 82.5 /100 | #143 | Excellent $45,043 |
| Icelanders | 81.6 /100 | #144 | Excellent $44,987 |
| Immigrants | Afghanistan | 78.0 /100 | #145 | Good $44,790 |
| Irish | 75.8 /100 | #146 | Good $44,679 |