Chinese vs Basque Per Capita Income
COMPARE
Chinese
Basque
Per Capita Income
Per Capita Income Comparison
Chinese
Basques
$46,098
PER CAPITA INCOME
93.9/ 100
METRIC RATING
117th/ 347
METRIC RANK
$45,086
PER CAPITA INCOME
83.2/ 100
METRIC RATING
139th/ 347
METRIC RANK
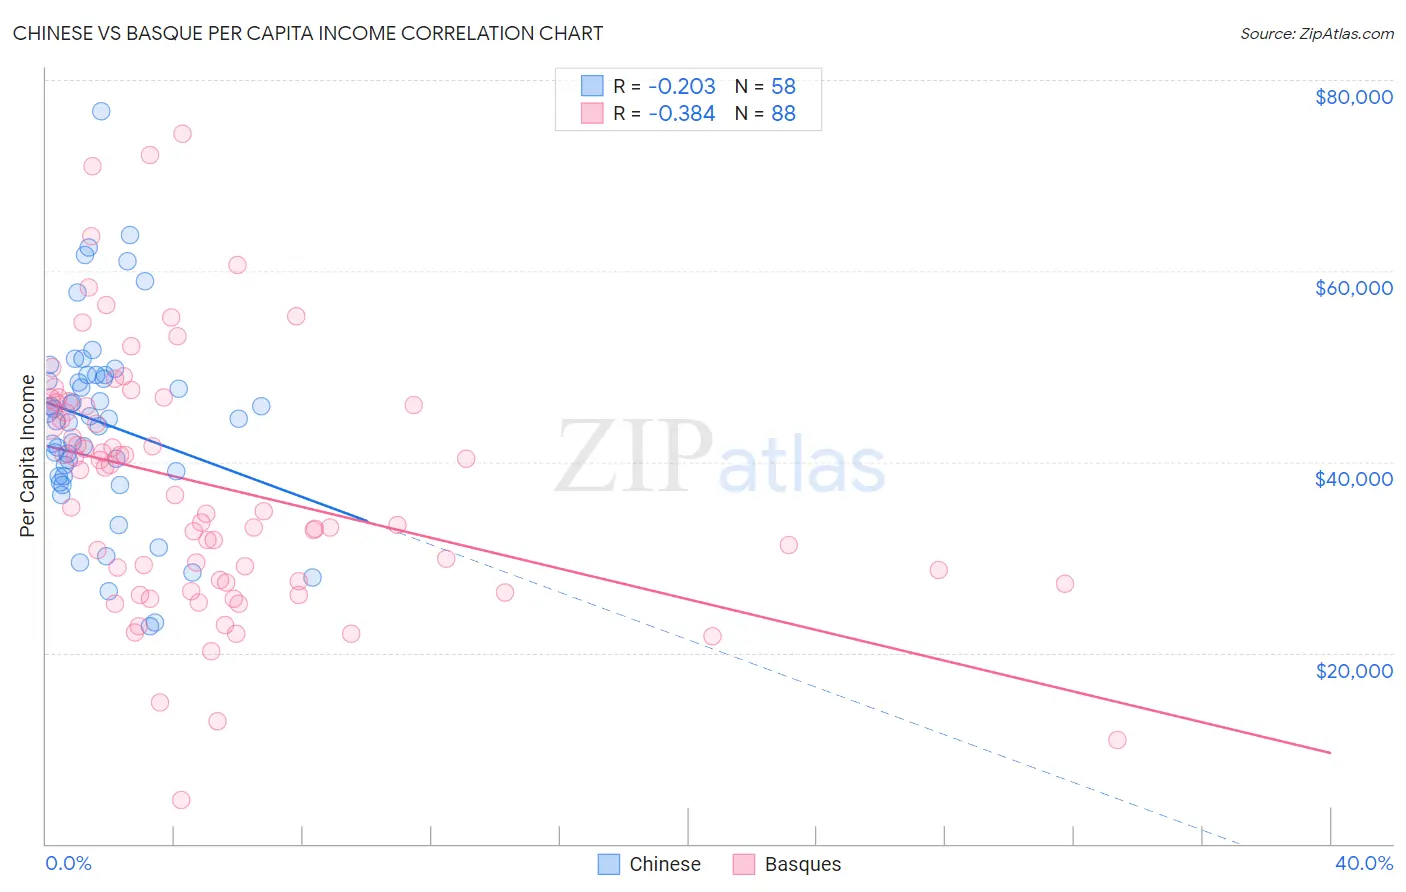
Chinese vs Basque Per Capita Income Correlation Chart
The statistical analysis conducted on geographies consisting of 64,809,125 people shows a weak negative correlation between the proportion of Chinese and per capita income in the United States with a correlation coefficient (R) of -0.203 and weighted average of $46,098. Similarly, the statistical analysis conducted on geographies consisting of 165,779,827 people shows a mild negative correlation between the proportion of Basques and per capita income in the United States with a correlation coefficient (R) of -0.384 and weighted average of $45,086, a difference of 2.2%.
Per Capita Income Correlation Summary
| Measurement | Chinese | Basque |
| Minimum | $22,765 | $4,617 |
| Maximum | $76,789 | $74,412 |
| Range | $54,024 | $69,795 |
| Mean | $44,105 | $37,448 |
| Median | $44,514 | $35,882 |
| Interquartile 25% (IQ1) | $38,432 | $27,463 |
| Interquartile 75% (IQ3) | $49,089 | $46,112 |
| Interquartile Range (IQR) | $10,657 | $18,649 |
| Standard Deviation (Sample) | $10,226 | $13,380 |
| Standard Deviation (Population) | $10,137 | $13,304 |
Similar Demographics by Per Capita Income
Demographics Similar to Chinese by Per Capita Income
In terms of per capita income, the demographic groups most similar to Chinese are Polish ($46,123, a difference of 0.050%), Immigrants from Saudi Arabia ($46,008, a difference of 0.19%), Immigrants from Chile ($46,213, a difference of 0.25%), Immigrants from Poland ($45,979, a difference of 0.26%), and Afghan ($46,268, a difference of 0.37%).
| Demographics | Rating | Rank | Per Capita Income |
| Chileans | 95.9 /100 | #110 | Exceptional $46,459 |
| Taiwanese | 95.8 /100 | #111 | Exceptional $46,455 |
| Immigrants | Morocco | 95.7 /100 | #112 | Exceptional $46,430 |
| Immigrants | Albania | 95.5 /100 | #113 | Exceptional $46,387 |
| Afghans | 94.9 /100 | #114 | Exceptional $46,268 |
| Immigrants | Chile | 94.6 /100 | #115 | Exceptional $46,213 |
| Poles | 94.1 /100 | #116 | Exceptional $46,123 |
| Chinese | 93.9 /100 | #117 | Exceptional $46,098 |
| Immigrants | Saudi Arabia | 93.3 /100 | #118 | Exceptional $46,008 |
| Immigrants | Poland | 93.1 /100 | #119 | Exceptional $45,979 |
| Immigrants | Ethiopia | 92.7 /100 | #120 | Exceptional $45,923 |
| Canadians | 92.2 /100 | #121 | Exceptional $45,858 |
| Moroccans | 92.1 /100 | #122 | Exceptional $45,854 |
| Lebanese | 92.0 /100 | #123 | Exceptional $45,840 |
| Europeans | 92.0 /100 | #124 | Exceptional $45,836 |
Demographics Similar to Basques by Per Capita Income
In terms of per capita income, the demographic groups most similar to Basques are Immigrants from Jordan ($45,066, a difference of 0.050%), Slavic ($45,049, a difference of 0.080%), Ugandan ($45,047, a difference of 0.090%), Immigrants from Uganda ($45,043, a difference of 0.10%), and Icelander ($44,987, a difference of 0.22%).
| Demographics | Rating | Rank | Per Capita Income |
| Jordanians | 89.9 /100 | #132 | Excellent $45,605 |
| Pakistanis | 89.7 /100 | #133 | Excellent $45,587 |
| Slovenes | 89.6 /100 | #134 | Excellent $45,581 |
| Hungarians | 87.9 /100 | #135 | Excellent $45,426 |
| Immigrants | Oceania | 85.2 /100 | #136 | Excellent $45,220 |
| Immigrants | Syria | 85.2 /100 | #137 | Excellent $45,218 |
| Assyrians/Chaldeans/Syriacs | 84.8 /100 | #138 | Excellent $45,195 |
| Basques | 83.2 /100 | #139 | Excellent $45,086 |
| Immigrants | Jordan | 82.9 /100 | #140 | Excellent $45,066 |
| Slavs | 82.6 /100 | #141 | Excellent $45,049 |
| Ugandans | 82.6 /100 | #142 | Excellent $45,047 |
| Immigrants | Uganda | 82.5 /100 | #143 | Excellent $45,043 |
| Icelanders | 81.6 /100 | #144 | Excellent $44,987 |
| Immigrants | Afghanistan | 78.0 /100 | #145 | Good $44,790 |
| Irish | 75.8 /100 | #146 | Good $44,679 |