Indonesian vs Immigrants from Cambodia Median Family Income
COMPARE
Indonesian
Immigrants from Cambodia
Median Family Income
Median Family Income Comparison
Indonesians
Immigrants from Cambodia
$88,301
MEDIAN FAMILY INCOME
0.1/ 100
METRIC RATING
284th/ 347
METRIC RANK
$97,222
MEDIAN FAMILY INCOME
5.8/ 100
METRIC RATING
218th/ 347
METRIC RANK
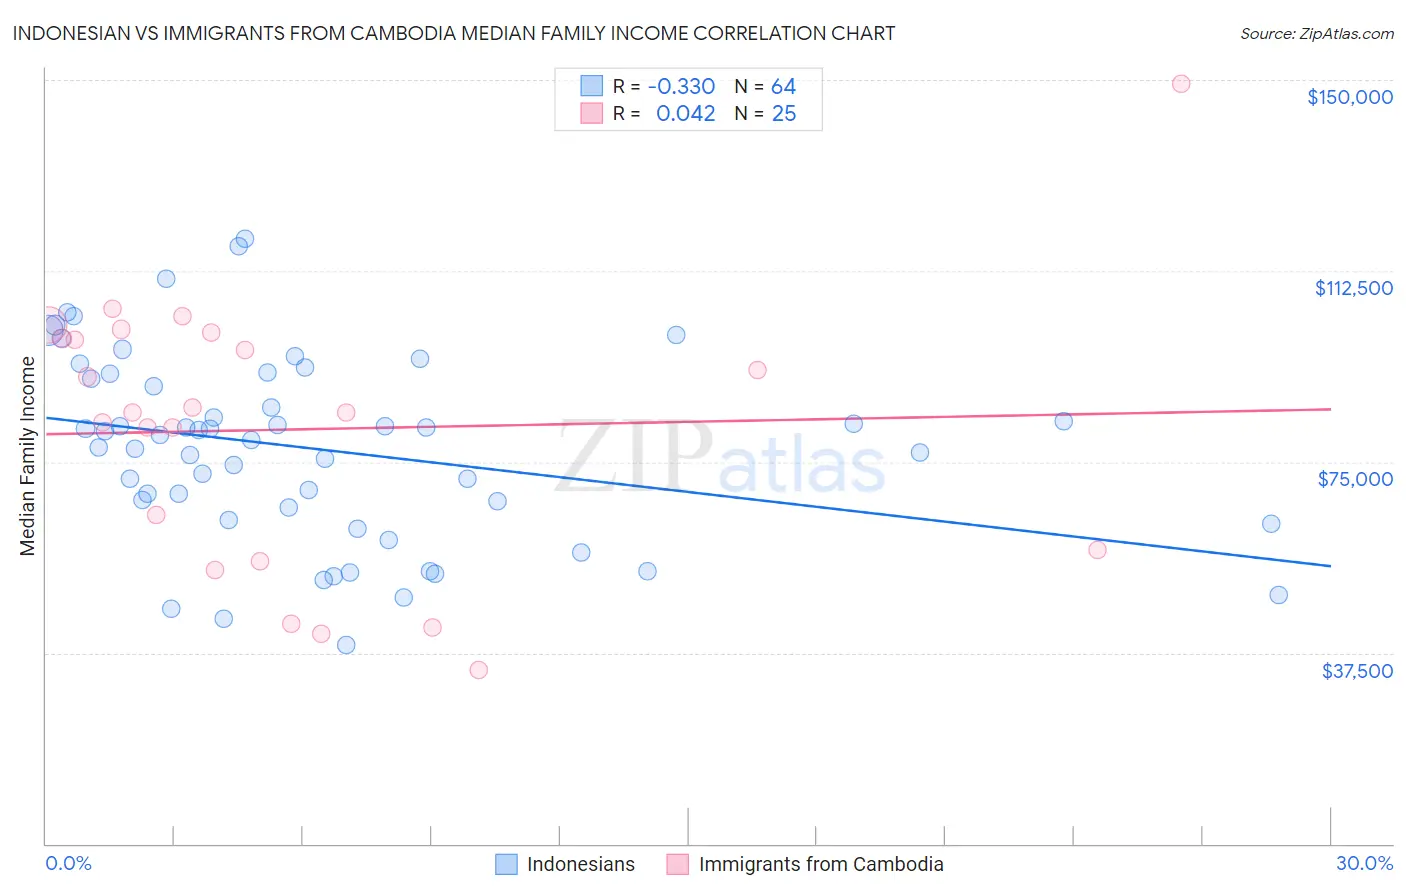
Indonesian vs Immigrants from Cambodia Median Family Income Correlation Chart
The statistical analysis conducted on geographies consisting of 162,594,892 people shows a mild negative correlation between the proportion of Indonesians and median family income in the United States with a correlation coefficient (R) of -0.330 and weighted average of $88,301. Similarly, the statistical analysis conducted on geographies consisting of 205,119,911 people shows no correlation between the proportion of Immigrants from Cambodia and median family income in the United States with a correlation coefficient (R) of 0.042 and weighted average of $97,222, a difference of 10.1%.
Median Family Income Correlation Summary
| Measurement | Indonesian | Immigrants from Cambodia |
| Minimum | $39,136 | $34,076 |
| Maximum | $118,875 | $149,239 |
| Range | $79,739 | $115,163 |
| Mean | $77,501 | $81,395 |
| Median | $79,746 | $84,615 |
| Interquartile 25% (IQ1) | $64,843 | $56,570 |
| Interquartile 75% (IQ3) | $91,846 | $99,835 |
| Interquartile Range (IQR) | $27,003 | $43,265 |
| Standard Deviation (Sample) | $18,499 | $26,680 |
| Standard Deviation (Population) | $18,353 | $26,141 |
Similar Demographics by Median Family Income
Demographics Similar to Indonesians by Median Family Income
In terms of median family income, the demographic groups most similar to Indonesians are Guatemalan ($88,295, a difference of 0.010%), Immigrants from Nicaragua ($88,267, a difference of 0.040%), Potawatomi ($88,265, a difference of 0.040%), Bangladeshi ($88,358, a difference of 0.060%), and Cherokee ($88,209, a difference of 0.10%).
| Demographics | Rating | Rank | Median Family Income |
| Immigrants | Jamaica | 0.1 /100 | #277 | Tragic $89,268 |
| Immigrants | Grenada | 0.1 /100 | #278 | Tragic $89,249 |
| Immigrants | Belize | 0.1 /100 | #279 | Tragic $89,197 |
| British West Indians | 0.1 /100 | #280 | Tragic $88,987 |
| Blackfeet | 0.1 /100 | #281 | Tragic $88,717 |
| Comanche | 0.1 /100 | #282 | Tragic $88,556 |
| Bangladeshis | 0.1 /100 | #283 | Tragic $88,358 |
| Indonesians | 0.1 /100 | #284 | Tragic $88,301 |
| Guatemalans | 0.1 /100 | #285 | Tragic $88,295 |
| Immigrants | Nicaragua | 0.1 /100 | #286 | Tragic $88,267 |
| Potawatomi | 0.1 /100 | #287 | Tragic $88,265 |
| Cherokee | 0.1 /100 | #288 | Tragic $88,209 |
| Central American Indians | 0.1 /100 | #289 | Tragic $88,034 |
| Shoshone | 0.1 /100 | #290 | Tragic $87,872 |
| Immigrants | Cabo Verde | 0.1 /100 | #291 | Tragic $87,830 |
Demographics Similar to Immigrants from Cambodia by Median Family Income
In terms of median family income, the demographic groups most similar to Immigrants from Cambodia are Japanese ($97,288, a difference of 0.070%), Immigrants from Bosnia and Herzegovina ($97,432, a difference of 0.22%), Delaware ($96,958, a difference of 0.27%), Nigerian ($97,522, a difference of 0.31%), and Bermudan ($97,577, a difference of 0.36%).
| Demographics | Rating | Rank | Median Family Income |
| Immigrants | Sudan | 7.4 /100 | #211 | Tragic $97,737 |
| Panamanians | 7.2 /100 | #212 | Tragic $97,683 |
| Immigrants | Armenia | 7.0 /100 | #213 | Tragic $97,605 |
| Bermudans | 6.9 /100 | #214 | Tragic $97,577 |
| Nigerians | 6.7 /100 | #215 | Tragic $97,522 |
| Immigrants | Bosnia and Herzegovina | 6.4 /100 | #216 | Tragic $97,432 |
| Japanese | 6.0 /100 | #217 | Tragic $97,288 |
| Immigrants | Cambodia | 5.8 /100 | #218 | Tragic $97,222 |
| Delaware | 5.1 /100 | #219 | Tragic $96,958 |
| Sudanese | 4.7 /100 | #220 | Tragic $96,783 |
| Immigrants | Ghana | 4.2 /100 | #221 | Tragic $96,544 |
| Immigrants | Nigeria | 4.0 /100 | #222 | Tragic $96,439 |
| Venezuelans | 3.7 /100 | #223 | Tragic $96,281 |
| Immigrants | Nonimmigrants | 3.6 /100 | #224 | Tragic $96,231 |
| Vietnamese | 3.4 /100 | #225 | Tragic $96,123 |