Indonesian vs Immigrants from Ukraine Single Mother Households
COMPARE
Indonesian
Immigrants from Ukraine
Single Mother Households
Single Mother Households Comparison
Indonesians
Immigrants from Ukraine
7.5%
SINGLE MOTHER HOUSEHOLDS
0.1/ 100
METRIC RATING
268th/ 347
METRIC RANK
5.8%
SINGLE MOTHER HOUSEHOLDS
95.9/ 100
METRIC RATING
106th/ 347
METRIC RANK
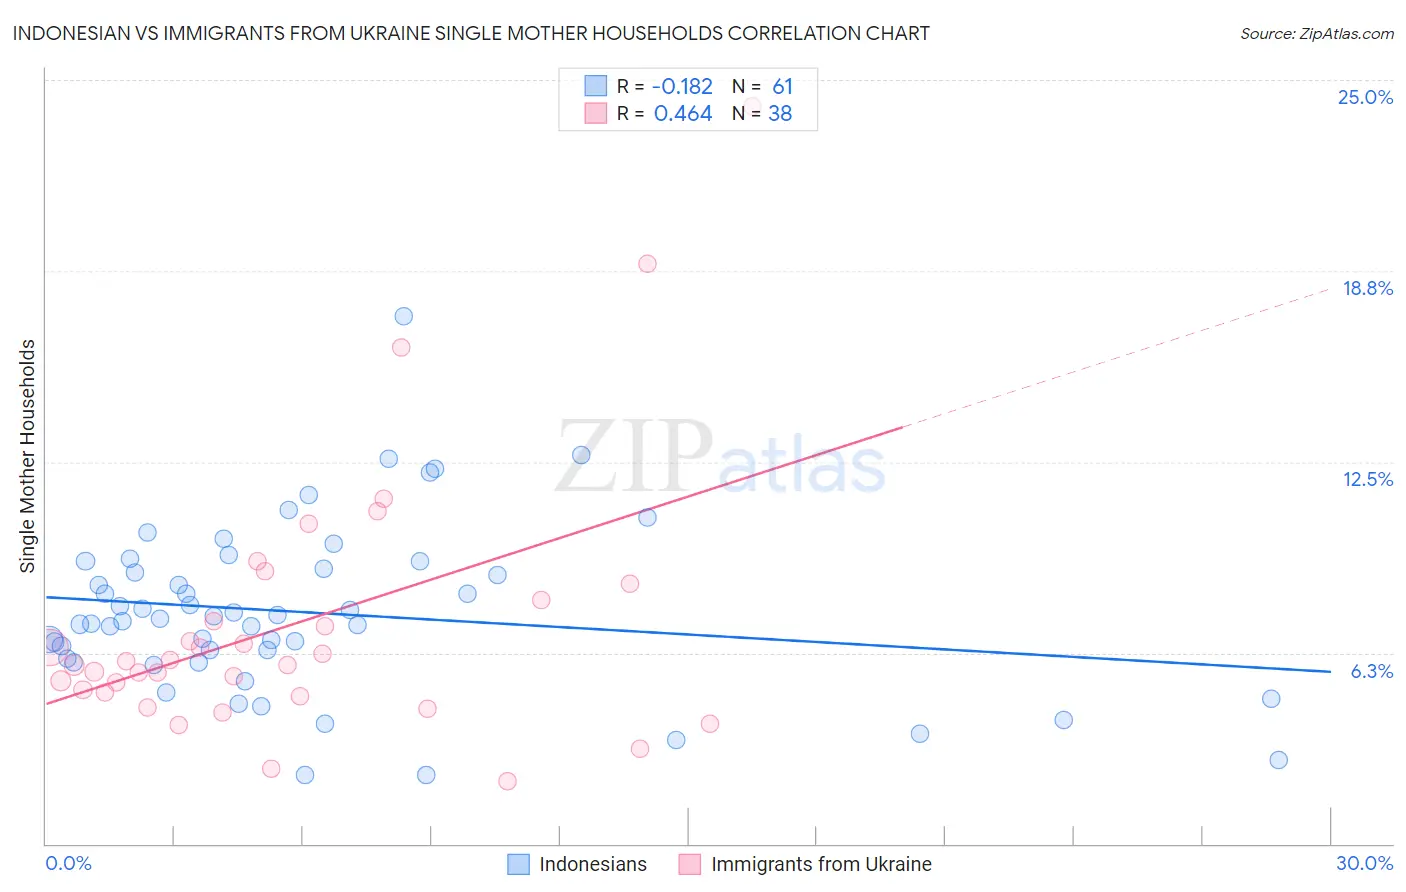
Indonesian vs Immigrants from Ukraine Single Mother Households Correlation Chart
The statistical analysis conducted on geographies consisting of 162,449,880 people shows a poor negative correlation between the proportion of Indonesians and percentage of single mother households in the United States with a correlation coefficient (R) of -0.182 and weighted average of 7.5%. Similarly, the statistical analysis conducted on geographies consisting of 289,094,970 people shows a moderate positive correlation between the proportion of Immigrants from Ukraine and percentage of single mother households in the United States with a correlation coefficient (R) of 0.464 and weighted average of 5.8%, a difference of 29.8%.
Single Mother Households Correlation Summary
| Measurement | Indonesian | Immigrants from Ukraine |
| Minimum | 2.2% | 2.1% |
| Maximum | 17.3% | 24.1% |
| Range | 15.0% | 22.1% |
| Mean | 7.6% | 7.2% |
| Median | 7.4% | 5.9% |
| Interquartile 25% (IQ1) | 6.0% | 4.9% |
| Interquartile 75% (IQ3) | 9.1% | 8.0% |
| Interquartile Range (IQR) | 3.1% | 3.1% |
| Standard Deviation (Sample) | 2.8% | 4.4% |
| Standard Deviation (Population) | 2.7% | 4.3% |
Similar Demographics by Single Mother Households
Demographics Similar to Indonesians by Single Mother Households
In terms of single mother households, the demographic groups most similar to Indonesians are Blackfeet (7.5%, a difference of 0.040%), Nepalese (7.5%, a difference of 0.38%), Somali (7.5%, a difference of 0.41%), Crow (7.4%, a difference of 0.48%), and Immigrants from Cuba (7.5%, a difference of 0.58%).
| Demographics | Rating | Rank | Single Mother Households |
| Japanese | 0.2 /100 | #261 | Tragic 7.4% |
| Immigrants | Somalia | 0.2 /100 | #262 | Tragic 7.4% |
| Immigrants | Nicaragua | 0.2 /100 | #263 | Tragic 7.4% |
| Yaqui | 0.1 /100 | #264 | Tragic 7.4% |
| Crow | 0.1 /100 | #265 | Tragic 7.4% |
| Nepalese | 0.1 /100 | #266 | Tragic 7.5% |
| Blackfeet | 0.1 /100 | #267 | Tragic 7.5% |
| Indonesians | 0.1 /100 | #268 | Tragic 7.5% |
| Somalis | 0.1 /100 | #269 | Tragic 7.5% |
| Immigrants | Cuba | 0.1 /100 | #270 | Tragic 7.5% |
| Salvadorans | 0.1 /100 | #271 | Tragic 7.5% |
| Immigrants | Azores | 0.1 /100 | #272 | Tragic 7.5% |
| Belizeans | 0.1 /100 | #273 | Tragic 7.6% |
| Immigrants | Guyana | 0.1 /100 | #274 | Tragic 7.6% |
| Central American Indians | 0.1 /100 | #275 | Tragic 7.6% |
Demographics Similar to Immigrants from Ukraine by Single Mother Households
In terms of single mother households, the demographic groups most similar to Immigrants from Ukraine are Taiwanese (5.8%, a difference of 0.10%), Paraguayan (5.8%, a difference of 0.11%), Immigrants from Italy (5.8%, a difference of 0.12%), Scottish (5.8%, a difference of 0.18%), and Northern European (5.8%, a difference of 0.18%).
| Demographics | Rating | Rank | Single Mother Households |
| Immigrants | Poland | 96.3 /100 | #99 | Exceptional 5.8% |
| Scandinavians | 96.2 /100 | #100 | Exceptional 5.8% |
| Germans | 96.2 /100 | #101 | Exceptional 5.8% |
| English | 96.2 /100 | #102 | Exceptional 5.8% |
| Scottish | 96.2 /100 | #103 | Exceptional 5.8% |
| Northern Europeans | 96.2 /100 | #104 | Exceptional 5.8% |
| Taiwanese | 96.1 /100 | #105 | Exceptional 5.8% |
| Immigrants | Ukraine | 95.9 /100 | #106 | Exceptional 5.8% |
| Paraguayans | 95.8 /100 | #107 | Exceptional 5.8% |
| Immigrants | Italy | 95.8 /100 | #108 | Exceptional 5.8% |
| Immigrants | Western Europe | 95.7 /100 | #109 | Exceptional 5.8% |
| British | 95.5 /100 | #110 | Exceptional 5.8% |
| Immigrants | England | 95.5 /100 | #111 | Exceptional 5.8% |
| Immigrants | Kuwait | 95.4 /100 | #112 | Exceptional 5.8% |
| Mongolians | 95.3 /100 | #113 | Exceptional 5.8% |