Indonesian vs Slavic Median Family Income
COMPARE
Indonesian
Slavic
Median Family Income
Median Family Income Comparison
Indonesians
Slavs
$88,301
MEDIAN FAMILY INCOME
0.1/ 100
METRIC RATING
284th/ 347
METRIC RANK
$105,144
MEDIAN FAMILY INCOME
77.9/ 100
METRIC RATING
153rd/ 347
METRIC RANK
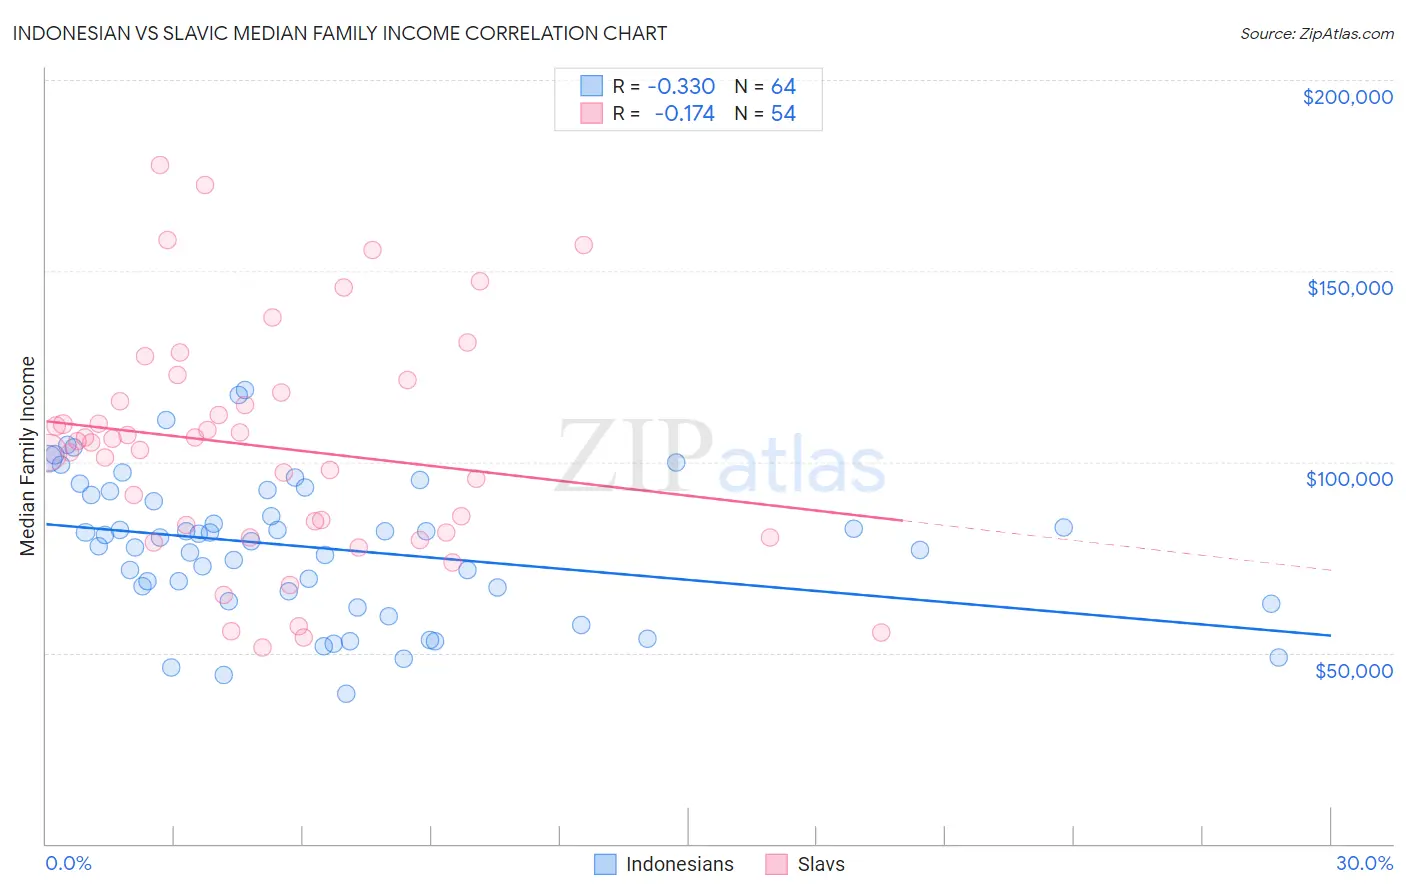
Indonesian vs Slavic Median Family Income Correlation Chart
The statistical analysis conducted on geographies consisting of 162,594,892 people shows a mild negative correlation between the proportion of Indonesians and median family income in the United States with a correlation coefficient (R) of -0.330 and weighted average of $88,301. Similarly, the statistical analysis conducted on geographies consisting of 270,767,146 people shows a poor negative correlation between the proportion of Slavs and median family income in the United States with a correlation coefficient (R) of -0.174 and weighted average of $105,144, a difference of 19.1%.
Median Family Income Correlation Summary
| Measurement | Indonesian | Slavic |
| Minimum | $39,136 | $51,429 |
| Maximum | $118,875 | $177,700 |
| Range | $79,739 | $126,271 |
| Mean | $77,501 | $103,941 |
| Median | $79,746 | $105,172 |
| Interquartile 25% (IQ1) | $64,843 | $81,417 |
| Interquartile 75% (IQ3) | $91,846 | $118,102 |
| Interquartile Range (IQR) | $27,003 | $36,685 |
| Standard Deviation (Sample) | $18,499 | $30,026 |
| Standard Deviation (Population) | $18,353 | $29,746 |
Similar Demographics by Median Family Income
Demographics Similar to Indonesians by Median Family Income
In terms of median family income, the demographic groups most similar to Indonesians are Guatemalan ($88,295, a difference of 0.010%), Immigrants from Nicaragua ($88,267, a difference of 0.040%), Potawatomi ($88,265, a difference of 0.040%), Bangladeshi ($88,358, a difference of 0.060%), and Cherokee ($88,209, a difference of 0.10%).
| Demographics | Rating | Rank | Median Family Income |
| Immigrants | Jamaica | 0.1 /100 | #277 | Tragic $89,268 |
| Immigrants | Grenada | 0.1 /100 | #278 | Tragic $89,249 |
| Immigrants | Belize | 0.1 /100 | #279 | Tragic $89,197 |
| British West Indians | 0.1 /100 | #280 | Tragic $88,987 |
| Blackfeet | 0.1 /100 | #281 | Tragic $88,717 |
| Comanche | 0.1 /100 | #282 | Tragic $88,556 |
| Bangladeshis | 0.1 /100 | #283 | Tragic $88,358 |
| Indonesians | 0.1 /100 | #284 | Tragic $88,301 |
| Guatemalans | 0.1 /100 | #285 | Tragic $88,295 |
| Immigrants | Nicaragua | 0.1 /100 | #286 | Tragic $88,267 |
| Potawatomi | 0.1 /100 | #287 | Tragic $88,265 |
| Cherokee | 0.1 /100 | #288 | Tragic $88,209 |
| Central American Indians | 0.1 /100 | #289 | Tragic $88,034 |
| Shoshone | 0.1 /100 | #290 | Tragic $87,872 |
| Immigrants | Cabo Verde | 0.1 /100 | #291 | Tragic $87,830 |
Demographics Similar to Slavs by Median Family Income
In terms of median family income, the demographic groups most similar to Slavs are Immigrants from Albania ($105,285, a difference of 0.13%), Immigrants from Nepal ($104,966, a difference of 0.17%), Native Hawaiian ($104,910, a difference of 0.22%), Peruvian ($105,444, a difference of 0.28%), and Irish ($105,453, a difference of 0.29%).
| Demographics | Rating | Rank | Median Family Income |
| Czechs | 83.4 /100 | #146 | Excellent $105,839 |
| Immigrants | Chile | 82.1 /100 | #147 | Excellent $105,655 |
| Hungarians | 81.7 /100 | #148 | Excellent $105,609 |
| Immigrants | Germany | 80.9 /100 | #149 | Excellent $105,507 |
| Irish | 80.5 /100 | #150 | Excellent $105,453 |
| Peruvians | 80.4 /100 | #151 | Excellent $105,444 |
| Immigrants | Albania | 79.1 /100 | #152 | Good $105,285 |
| Slavs | 77.9 /100 | #153 | Good $105,144 |
| Immigrants | Nepal | 76.3 /100 | #154 | Good $104,966 |
| Native Hawaiians | 75.8 /100 | #155 | Good $104,910 |
| Basques | 74.4 /100 | #156 | Good $104,760 |
| Moroccans | 71.6 /100 | #157 | Good $104,488 |
| Scandinavians | 70.8 /100 | #158 | Good $104,410 |
| Swiss | 70.7 /100 | #159 | Good $104,396 |
| Scottish | 69.5 /100 | #160 | Good $104,288 |