Immigrants vs Immigrants from Scotland Householder Income Ages 45 - 64 years
COMPARE
Immigrants
Immigrants from Scotland
Householder Income Ages 45 - 64 years
Householder Income Ages 45 - 64 years Comparison
Immigrants
Immigrants from Scotland
$99,943
HOUSEHOLDER INCOME AGES 45 - 64 YEARS
45.3/ 100
METRIC RATING
181st/ 347
METRIC RANK
$112,175
HOUSEHOLDER INCOME AGES 45 - 64 YEARS
99.7/ 100
METRIC RATING
57th/ 347
METRIC RANK
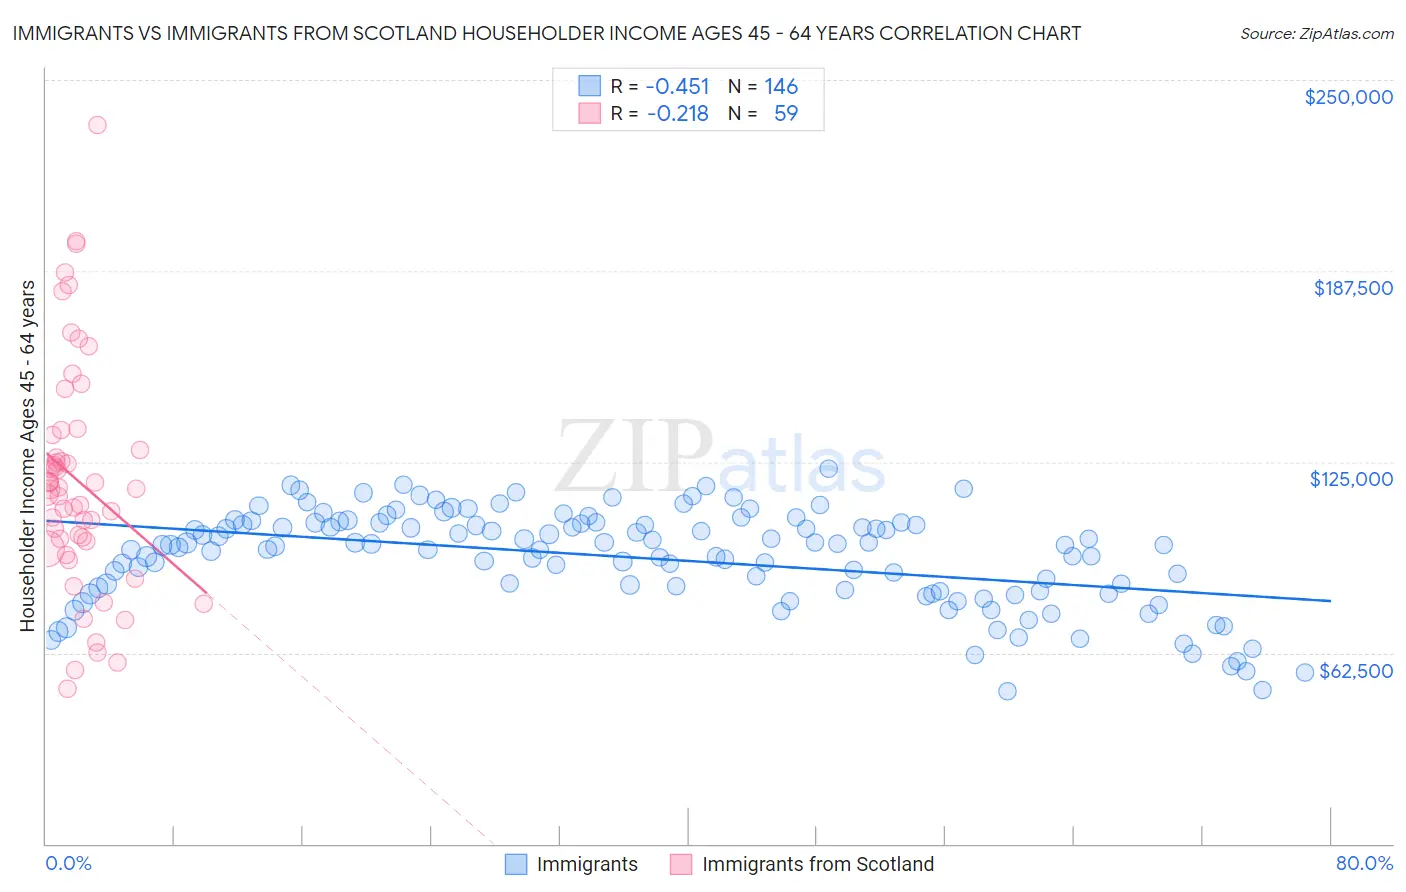
Immigrants vs Immigrants from Scotland Householder Income Ages 45 - 64 years Correlation Chart
The statistical analysis conducted on geographies consisting of 573,032,532 people shows a moderate negative correlation between the proportion of Immigrants and household income with householder between the ages 45 and 64 in the United States with a correlation coefficient (R) of -0.451 and weighted average of $99,943. Similarly, the statistical analysis conducted on geographies consisting of 196,306,060 people shows a weak negative correlation between the proportion of Immigrants from Scotland and household income with householder between the ages 45 and 64 in the United States with a correlation coefficient (R) of -0.218 and weighted average of $112,175, a difference of 12.2%.
Householder Income Ages 45 - 64 years Correlation Summary
| Measurement | Immigrants | Immigrants from Scotland |
| Minimum | $49,742 | $50,625 |
| Maximum | $122,626 | $235,104 |
| Range | $72,884 | $184,479 |
| Mean | $93,603 | $119,000 |
| Median | $97,670 | $116,045 |
| Interquartile 25% (IQ1) | $82,744 | $99,167 |
| Interquartile 75% (IQ3) | $104,952 | $133,636 |
| Interquartile Range (IQR) | $22,209 | $34,469 |
| Standard Deviation (Sample) | $15,834 | $37,312 |
| Standard Deviation (Population) | $15,779 | $36,994 |
Similar Demographics by Householder Income Ages 45 - 64 years
Demographics Similar to Immigrants by Householder Income Ages 45 - 64 years
In terms of householder income ages 45 - 64 years, the demographic groups most similar to Immigrants are Finnish ($99,904, a difference of 0.040%), Spaniard ($99,889, a difference of 0.050%), Aleut ($100,052, a difference of 0.11%), Belgian ($100,060, a difference of 0.12%), and French ($99,824, a difference of 0.12%).
| Demographics | Rating | Rank | Householder Income Ages 45 - 64 years |
| Welsh | 50.0 /100 | #174 | Average $100,322 |
| Germans | 48.8 /100 | #175 | Average $100,224 |
| Immigrants | Costa Rica | 47.7 /100 | #176 | Average $100,141 |
| Moroccans | 47.7 /100 | #177 | Average $100,138 |
| Immigrants | Cameroon | 47.0 /100 | #178 | Average $100,084 |
| Belgians | 46.7 /100 | #179 | Average $100,060 |
| Aleuts | 46.6 /100 | #180 | Average $100,052 |
| Immigrants | Immigrants | 45.3 /100 | #181 | Average $99,943 |
| Finns | 44.8 /100 | #182 | Average $99,904 |
| Spaniards | 44.6 /100 | #183 | Average $99,889 |
| French | 43.8 /100 | #184 | Average $99,824 |
| Colombians | 43.2 /100 | #185 | Average $99,772 |
| Dutch | 41.7 /100 | #186 | Average $99,650 |
| Iraqis | 38.5 /100 | #187 | Fair $99,387 |
| Immigrants | Portugal | 36.3 /100 | #188 | Fair $99,203 |
Demographics Similar to Immigrants from Scotland by Householder Income Ages 45 - 64 years
In terms of householder income ages 45 - 64 years, the demographic groups most similar to Immigrants from Scotland are Egyptian ($112,256, a difference of 0.070%), Soviet Union ($112,008, a difference of 0.15%), Immigrants from Europe ($111,984, a difference of 0.17%), Immigrants from Netherlands ($111,982, a difference of 0.17%), and Immigrants from Czechoslovakia ($111,914, a difference of 0.23%).
| Demographics | Rating | Rank | Householder Income Ages 45 - 64 years |
| Immigrants | Austria | 99.8 /100 | #50 | Exceptional $113,140 |
| Immigrants | South Africa | 99.8 /100 | #51 | Exceptional $112,886 |
| Immigrants | Malaysia | 99.8 /100 | #52 | Exceptional $112,796 |
| Afghans | 99.8 /100 | #53 | Exceptional $112,676 |
| Greeks | 99.8 /100 | #54 | Exceptional $112,630 |
| Lithuanians | 99.8 /100 | #55 | Exceptional $112,484 |
| Egyptians | 99.7 /100 | #56 | Exceptional $112,256 |
| Immigrants | Scotland | 99.7 /100 | #57 | Exceptional $112,175 |
| Soviet Union | 99.7 /100 | #58 | Exceptional $112,008 |
| Immigrants | Europe | 99.7 /100 | #59 | Exceptional $111,984 |
| Immigrants | Netherlands | 99.7 /100 | #60 | Exceptional $111,982 |
| Immigrants | Czechoslovakia | 99.7 /100 | #61 | Exceptional $111,914 |
| Immigrants | Norway | 99.7 /100 | #62 | Exceptional $111,669 |
| Mongolians | 99.6 /100 | #63 | Exceptional $111,602 |
| Immigrants | Latvia | 99.6 /100 | #64 | Exceptional $111,454 |