Immigrants from Southern Europe vs Immigrants from Scotland Householder Income Ages 45 - 64 years
COMPARE
Immigrants from Southern Europe
Immigrants from Scotland
Householder Income Ages 45 - 64 years
Householder Income Ages 45 - 64 years Comparison
Immigrants from Southern Europe
Immigrants from Scotland
$107,775
HOUSEHOLDER INCOME AGES 45 - 64 YEARS
97.7/ 100
METRIC RATING
98th/ 347
METRIC RANK
$112,175
HOUSEHOLDER INCOME AGES 45 - 64 YEARS
99.7/ 100
METRIC RATING
57th/ 347
METRIC RANK
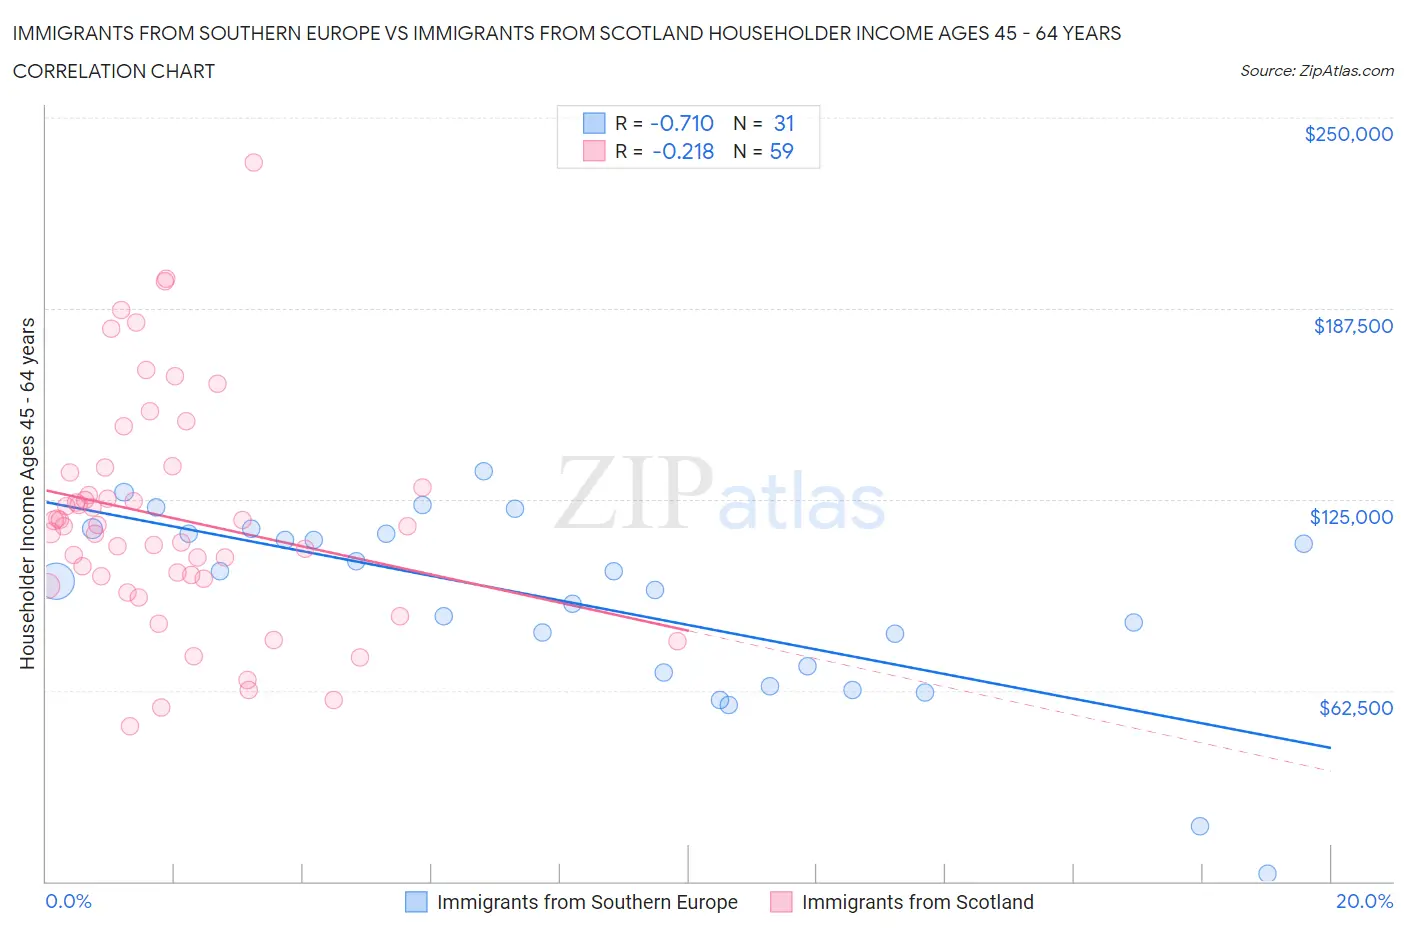
Immigrants from Southern Europe vs Immigrants from Scotland Householder Income Ages 45 - 64 years Correlation Chart
The statistical analysis conducted on geographies consisting of 402,204,768 people shows a strong negative correlation between the proportion of Immigrants from Southern Europe and household income with householder between the ages 45 and 64 in the United States with a correlation coefficient (R) of -0.710 and weighted average of $107,775. Similarly, the statistical analysis conducted on geographies consisting of 196,306,060 people shows a weak negative correlation between the proportion of Immigrants from Scotland and household income with householder between the ages 45 and 64 in the United States with a correlation coefficient (R) of -0.218 and weighted average of $112,175, a difference of 4.1%.
Householder Income Ages 45 - 64 years Correlation Summary
| Measurement | Immigrants from Southern Europe | Immigrants from Scotland |
| Minimum | $2,499 | $50,625 |
| Maximum | $134,237 | $235,104 |
| Range | $131,738 | $184,479 |
| Mean | $90,713 | $119,000 |
| Median | $98,268 | $116,045 |
| Interquartile 25% (IQ1) | $68,345 | $99,167 |
| Interquartile 75% (IQ3) | $113,880 | $133,636 |
| Interquartile Range (IQR) | $45,535 | $34,469 |
| Standard Deviation (Sample) | $31,080 | $37,312 |
| Standard Deviation (Population) | $30,575 | $36,994 |
Similar Demographics by Householder Income Ages 45 - 64 years
Demographics Similar to Immigrants from Southern Europe by Householder Income Ages 45 - 64 years
In terms of householder income ages 45 - 64 years, the demographic groups most similar to Immigrants from Southern Europe are Palestinian ($107,721, a difference of 0.050%), Northern European ($107,870, a difference of 0.090%), Immigrants from Serbia ($107,569, a difference of 0.19%), Immigrants from Kazakhstan ($107,378, a difference of 0.37%), and Immigrants from Moldova ($107,357, a difference of 0.39%).
| Demographics | Rating | Rank | Householder Income Ages 45 - 64 years |
| Immigrants | Lebanon | 98.3 /100 | #91 | Exceptional $108,471 |
| Croatians | 98.3 /100 | #92 | Exceptional $108,383 |
| Immigrants | Croatia | 98.2 /100 | #93 | Exceptional $108,304 |
| Sri Lankans | 98.2 /100 | #94 | Exceptional $108,270 |
| Immigrants | Hungary | 98.2 /100 | #95 | Exceptional $108,267 |
| Immigrants | Argentina | 98.2 /100 | #96 | Exceptional $108,264 |
| Northern Europeans | 97.8 /100 | #97 | Exceptional $107,870 |
| Immigrants | Southern Europe | 97.7 /100 | #98 | Exceptional $107,775 |
| Palestinians | 97.6 /100 | #99 | Exceptional $107,721 |
| Immigrants | Serbia | 97.4 /100 | #100 | Exceptional $107,569 |
| Immigrants | Kazakhstan | 97.2 /100 | #101 | Exceptional $107,378 |
| Immigrants | Moldova | 97.1 /100 | #102 | Exceptional $107,357 |
| Syrians | 96.9 /100 | #103 | Exceptional $107,207 |
| Immigrants | Ukraine | 96.7 /100 | #104 | Exceptional $107,079 |
| Macedonians | 96.7 /100 | #105 | Exceptional $107,074 |
Demographics Similar to Immigrants from Scotland by Householder Income Ages 45 - 64 years
In terms of householder income ages 45 - 64 years, the demographic groups most similar to Immigrants from Scotland are Egyptian ($112,256, a difference of 0.070%), Soviet Union ($112,008, a difference of 0.15%), Immigrants from Europe ($111,984, a difference of 0.17%), Immigrants from Netherlands ($111,982, a difference of 0.17%), and Immigrants from Czechoslovakia ($111,914, a difference of 0.23%).
| Demographics | Rating | Rank | Householder Income Ages 45 - 64 years |
| Immigrants | Austria | 99.8 /100 | #50 | Exceptional $113,140 |
| Immigrants | South Africa | 99.8 /100 | #51 | Exceptional $112,886 |
| Immigrants | Malaysia | 99.8 /100 | #52 | Exceptional $112,796 |
| Afghans | 99.8 /100 | #53 | Exceptional $112,676 |
| Greeks | 99.8 /100 | #54 | Exceptional $112,630 |
| Lithuanians | 99.8 /100 | #55 | Exceptional $112,484 |
| Egyptians | 99.7 /100 | #56 | Exceptional $112,256 |
| Immigrants | Scotland | 99.7 /100 | #57 | Exceptional $112,175 |
| Soviet Union | 99.7 /100 | #58 | Exceptional $112,008 |
| Immigrants | Europe | 99.7 /100 | #59 | Exceptional $111,984 |
| Immigrants | Netherlands | 99.7 /100 | #60 | Exceptional $111,982 |
| Immigrants | Czechoslovakia | 99.7 /100 | #61 | Exceptional $111,914 |
| Immigrants | Norway | 99.7 /100 | #62 | Exceptional $111,669 |
| Mongolians | 99.6 /100 | #63 | Exceptional $111,602 |
| Immigrants | Latvia | 99.6 /100 | #64 | Exceptional $111,454 |