Immigrants from South Africa vs Immigrants from Scotland Householder Income Ages 45 - 64 years
COMPARE
Immigrants from South Africa
Immigrants from Scotland
Householder Income Ages 45 - 64 years
Householder Income Ages 45 - 64 years Comparison
Immigrants from South Africa
Immigrants from Scotland
$112,886
HOUSEHOLDER INCOME AGES 45 - 64 YEARS
99.8/ 100
METRIC RATING
51st/ 347
METRIC RANK
$112,175
HOUSEHOLDER INCOME AGES 45 - 64 YEARS
99.7/ 100
METRIC RATING
57th/ 347
METRIC RANK
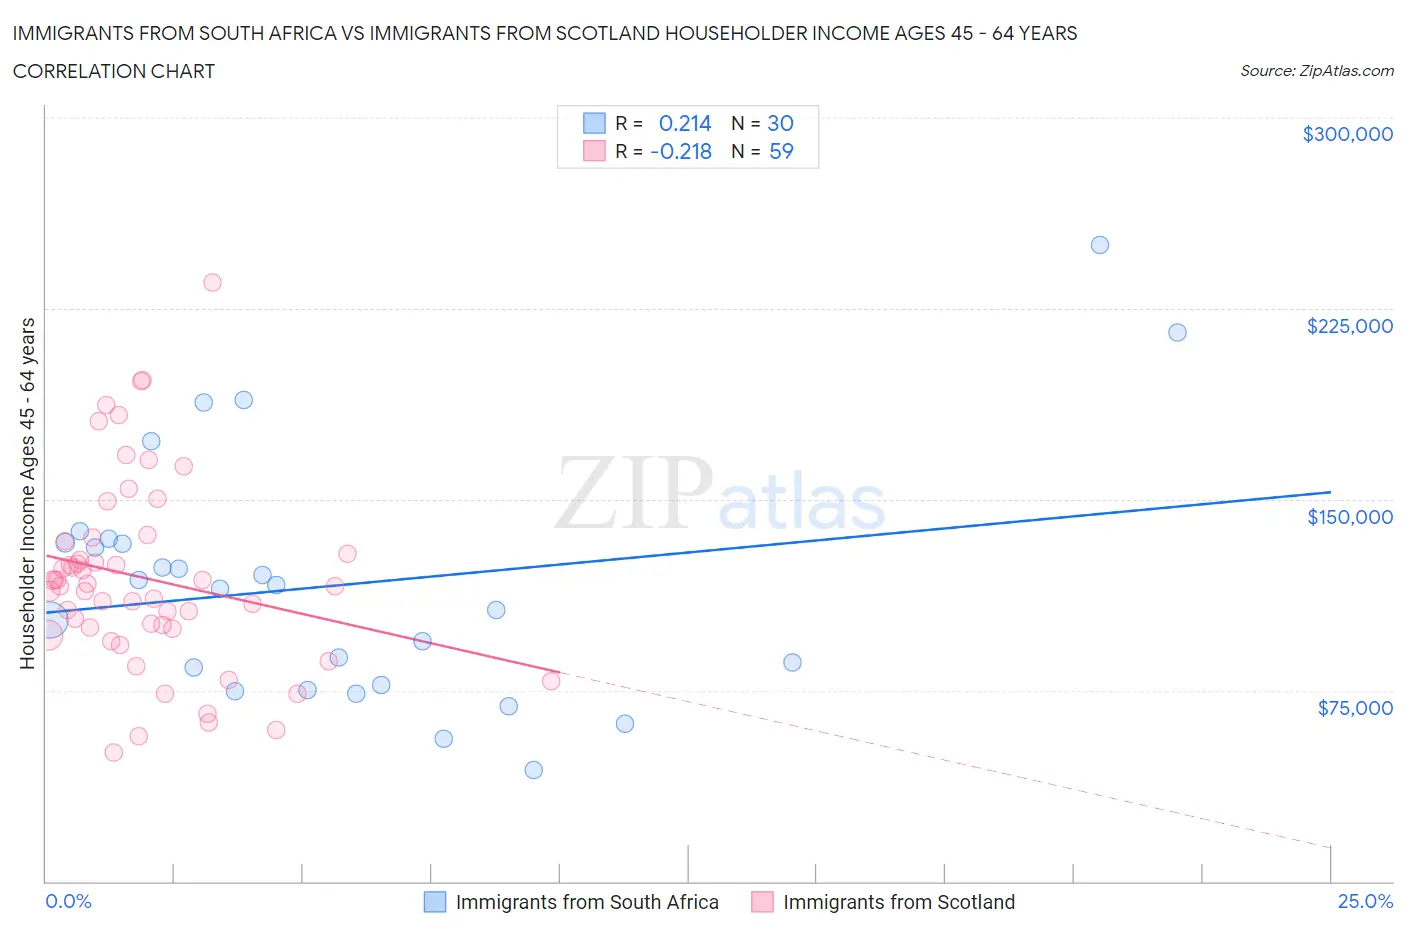
Immigrants from South Africa vs Immigrants from Scotland Householder Income Ages 45 - 64 years Correlation Chart
The statistical analysis conducted on geographies consisting of 233,154,360 people shows a weak positive correlation between the proportion of Immigrants from South Africa and household income with householder between the ages 45 and 64 in the United States with a correlation coefficient (R) of 0.214 and weighted average of $112,886. Similarly, the statistical analysis conducted on geographies consisting of 196,306,060 people shows a weak negative correlation between the proportion of Immigrants from Scotland and household income with householder between the ages 45 and 64 in the United States with a correlation coefficient (R) of -0.218 and weighted average of $112,175, a difference of 0.63%.
Householder Income Ages 45 - 64 years Correlation Summary
| Measurement | Immigrants from South Africa | Immigrants from Scotland |
| Minimum | $43,750 | $50,625 |
| Maximum | $250,001 | $235,104 |
| Range | $206,251 | $184,479 |
| Mean | $116,416 | $119,000 |
| Median | $115,780 | $116,045 |
| Interquartile 25% (IQ1) | $77,125 | $99,167 |
| Interquartile 75% (IQ3) | $133,043 | $133,636 |
| Interquartile Range (IQR) | $55,918 | $34,469 |
| Standard Deviation (Sample) | $48,210 | $37,312 |
| Standard Deviation (Population) | $47,400 | $36,994 |
Demographics Similar to Immigrants from South Africa and Immigrants from Scotland by Householder Income Ages 45 - 64 years
In terms of householder income ages 45 - 64 years, the demographic groups most similar to Immigrants from South Africa are Immigrants from Malaysia ($112,796, a difference of 0.080%), Afghan ($112,676, a difference of 0.19%), Immigrants from Austria ($113,140, a difference of 0.22%), Greek ($112,630, a difference of 0.23%), and Immigrants from Russia ($113,215, a difference of 0.29%). Similarly, the demographic groups most similar to Immigrants from Scotland are Egyptian ($112,256, a difference of 0.070%), Soviet Union ($112,008, a difference of 0.15%), Immigrants from Europe ($111,984, a difference of 0.17%), Immigrants from Netherlands ($111,982, a difference of 0.17%), and Immigrants from Czechoslovakia ($111,914, a difference of 0.23%).
| Demographics | Rating | Rank | Householder Income Ages 45 - 64 years |
| Bulgarians | 99.9 /100 | #44 | Exceptional $113,883 |
| Immigrants | France | 99.9 /100 | #45 | Exceptional $113,680 |
| Immigrants | Greece | 99.9 /100 | #46 | Exceptional $113,548 |
| Australians | 99.9 /100 | #47 | Exceptional $113,533 |
| Immigrants | Indonesia | 99.9 /100 | #48 | Exceptional $113,519 |
| Immigrants | Russia | 99.8 /100 | #49 | Exceptional $113,215 |
| Immigrants | Austria | 99.8 /100 | #50 | Exceptional $113,140 |
| Immigrants | South Africa | 99.8 /100 | #51 | Exceptional $112,886 |
| Immigrants | Malaysia | 99.8 /100 | #52 | Exceptional $112,796 |
| Afghans | 99.8 /100 | #53 | Exceptional $112,676 |
| Greeks | 99.8 /100 | #54 | Exceptional $112,630 |
| Lithuanians | 99.8 /100 | #55 | Exceptional $112,484 |
| Egyptians | 99.7 /100 | #56 | Exceptional $112,256 |
| Immigrants | Scotland | 99.7 /100 | #57 | Exceptional $112,175 |
| Soviet Union | 99.7 /100 | #58 | Exceptional $112,008 |
| Immigrants | Europe | 99.7 /100 | #59 | Exceptional $111,984 |
| Immigrants | Netherlands | 99.7 /100 | #60 | Exceptional $111,982 |
| Immigrants | Czechoslovakia | 99.7 /100 | #61 | Exceptional $111,914 |
| Immigrants | Norway | 99.7 /100 | #62 | Exceptional $111,669 |
| Mongolians | 99.6 /100 | #63 | Exceptional $111,602 |
| Immigrants | Latvia | 99.6 /100 | #64 | Exceptional $111,454 |