Immigrants vs Immigrants from Egypt Householder Income Ages 45 - 64 years
COMPARE
Immigrants
Immigrants from Egypt
Householder Income Ages 45 - 64 years
Householder Income Ages 45 - 64 years Comparison
Immigrants
Immigrants from Egypt
$99,943
HOUSEHOLDER INCOME AGES 45 - 64 YEARS
45.3/ 100
METRIC RATING
181st/ 347
METRIC RANK
$109,941
HOUSEHOLDER INCOME AGES 45 - 64 YEARS
99.2/ 100
METRIC RATING
74th/ 347
METRIC RANK
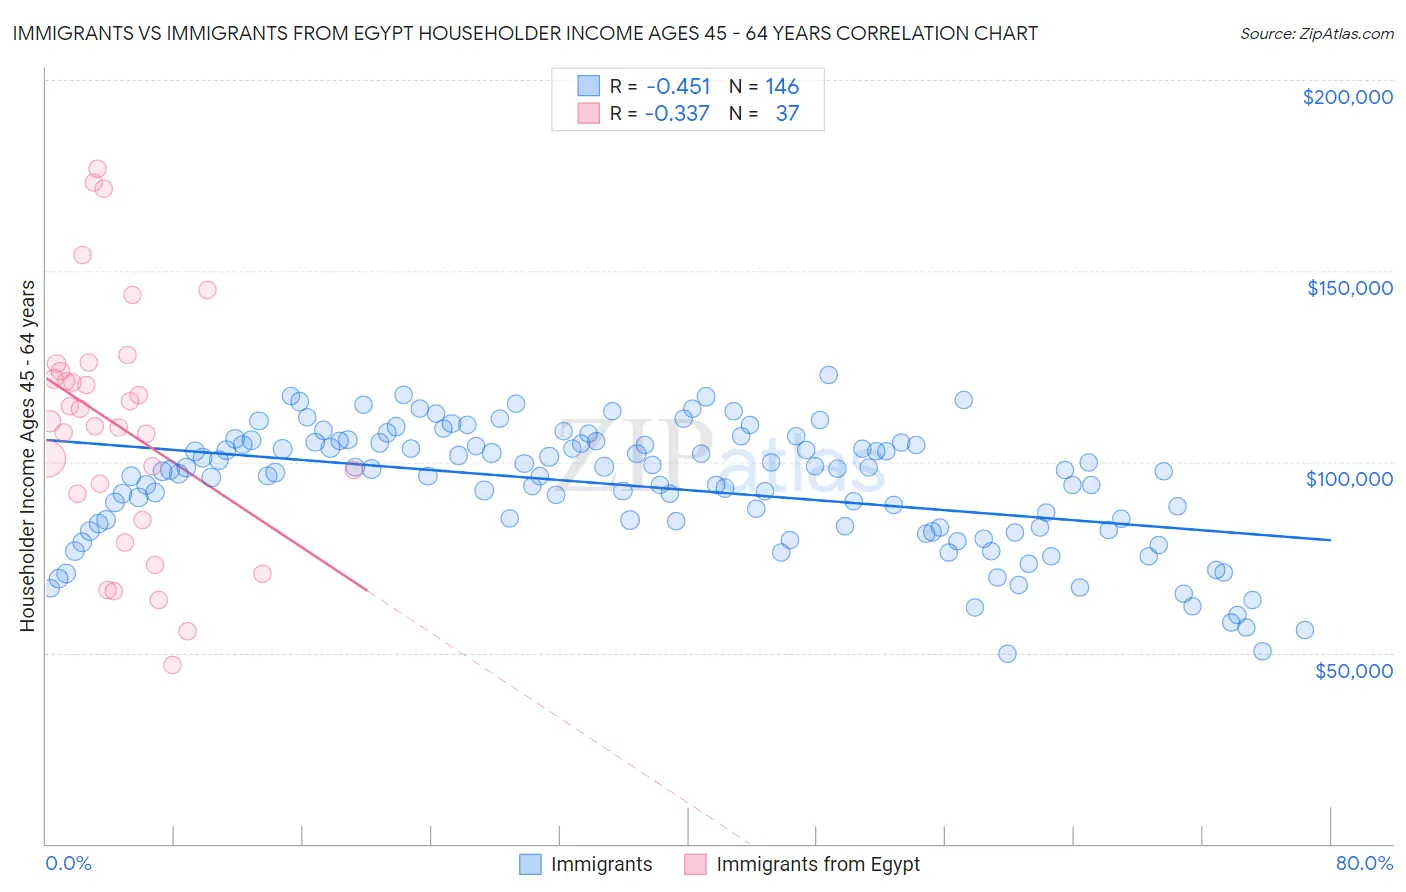
Immigrants vs Immigrants from Egypt Householder Income Ages 45 - 64 years Correlation Chart
The statistical analysis conducted on geographies consisting of 573,032,532 people shows a moderate negative correlation between the proportion of Immigrants and household income with householder between the ages 45 and 64 in the United States with a correlation coefficient (R) of -0.451 and weighted average of $99,943. Similarly, the statistical analysis conducted on geographies consisting of 245,345,786 people shows a mild negative correlation between the proportion of Immigrants from Egypt and household income with householder between the ages 45 and 64 in the United States with a correlation coefficient (R) of -0.337 and weighted average of $109,941, a difference of 10.0%.
Householder Income Ages 45 - 64 years Correlation Summary
| Measurement | Immigrants | Immigrants from Egypt |
| Minimum | $49,742 | $46,773 |
| Maximum | $122,626 | $176,674 |
| Range | $72,884 | $129,901 |
| Mean | $93,603 | $109,415 |
| Median | $97,670 | $110,780 |
| Interquartile 25% (IQ1) | $82,744 | $88,195 |
| Interquartile 75% (IQ3) | $104,952 | $124,792 |
| Interquartile Range (IQR) | $22,209 | $36,597 |
| Standard Deviation (Sample) | $15,834 | $31,863 |
| Standard Deviation (Population) | $15,779 | $31,429 |
Similar Demographics by Householder Income Ages 45 - 64 years
Demographics Similar to Immigrants by Householder Income Ages 45 - 64 years
In terms of householder income ages 45 - 64 years, the demographic groups most similar to Immigrants are Finnish ($99,904, a difference of 0.040%), Spaniard ($99,889, a difference of 0.050%), Aleut ($100,052, a difference of 0.11%), Belgian ($100,060, a difference of 0.12%), and French ($99,824, a difference of 0.12%).
| Demographics | Rating | Rank | Householder Income Ages 45 - 64 years |
| Welsh | 50.0 /100 | #174 | Average $100,322 |
| Germans | 48.8 /100 | #175 | Average $100,224 |
| Immigrants | Costa Rica | 47.7 /100 | #176 | Average $100,141 |
| Moroccans | 47.7 /100 | #177 | Average $100,138 |
| Immigrants | Cameroon | 47.0 /100 | #178 | Average $100,084 |
| Belgians | 46.7 /100 | #179 | Average $100,060 |
| Aleuts | 46.6 /100 | #180 | Average $100,052 |
| Immigrants | Immigrants | 45.3 /100 | #181 | Average $99,943 |
| Finns | 44.8 /100 | #182 | Average $99,904 |
| Spaniards | 44.6 /100 | #183 | Average $99,889 |
| French | 43.8 /100 | #184 | Average $99,824 |
| Colombians | 43.2 /100 | #185 | Average $99,772 |
| Dutch | 41.7 /100 | #186 | Average $99,650 |
| Iraqis | 38.5 /100 | #187 | Fair $99,387 |
| Immigrants | Portugal | 36.3 /100 | #188 | Fair $99,203 |
Demographics Similar to Immigrants from Egypt by Householder Income Ages 45 - 64 years
In terms of householder income ages 45 - 64 years, the demographic groups most similar to Immigrants from Egypt are Argentinean ($110,103, a difference of 0.15%), South African ($109,719, a difference of 0.20%), Assyrian/Chaldean/Syriac ($110,201, a difference of 0.24%), Italian ($110,224, a difference of 0.26%), and Korean ($110,334, a difference of 0.36%).
| Demographics | Rating | Rank | Householder Income Ages 45 - 64 years |
| Laotians | 99.5 /100 | #67 | Exceptional $111,051 |
| Immigrants | Romania | 99.4 /100 | #68 | Exceptional $110,633 |
| Immigrants | Italy | 99.4 /100 | #69 | Exceptional $110,434 |
| Koreans | 99.3 /100 | #70 | Exceptional $110,334 |
| Italians | 99.3 /100 | #71 | Exceptional $110,224 |
| Assyrians/Chaldeans/Syriacs | 99.3 /100 | #72 | Exceptional $110,201 |
| Argentineans | 99.3 /100 | #73 | Exceptional $110,103 |
| Immigrants | Egypt | 99.2 /100 | #74 | Exceptional $109,941 |
| South Africans | 99.1 /100 | #75 | Exceptional $109,719 |
| Paraguayans | 99.0 /100 | #76 | Exceptional $109,447 |
| Immigrants | England | 99.0 /100 | #77 | Exceptional $109,446 |
| Immigrants | Canada | 99.0 /100 | #78 | Exceptional $109,402 |
| Immigrants | Bulgaria | 98.9 /100 | #79 | Exceptional $109,379 |
| Jordanians | 98.9 /100 | #80 | Exceptional $109,376 |
| Immigrants | Eastern Europe | 98.9 /100 | #81 | Exceptional $109,335 |