Immigrants vs Immigrants from Western Europe Householder Income Ages 45 - 64 years
COMPARE
Immigrants
Immigrants from Western Europe
Householder Income Ages 45 - 64 years
Householder Income Ages 45 - 64 years Comparison
Immigrants
Immigrants from Western Europe
$99,943
HOUSEHOLDER INCOME AGES 45 - 64 YEARS
45.3/ 100
METRIC RATING
181st/ 347
METRIC RANK
$108,824
HOUSEHOLDER INCOME AGES 45 - 64 YEARS
98.6/ 100
METRIC RATING
84th/ 347
METRIC RANK
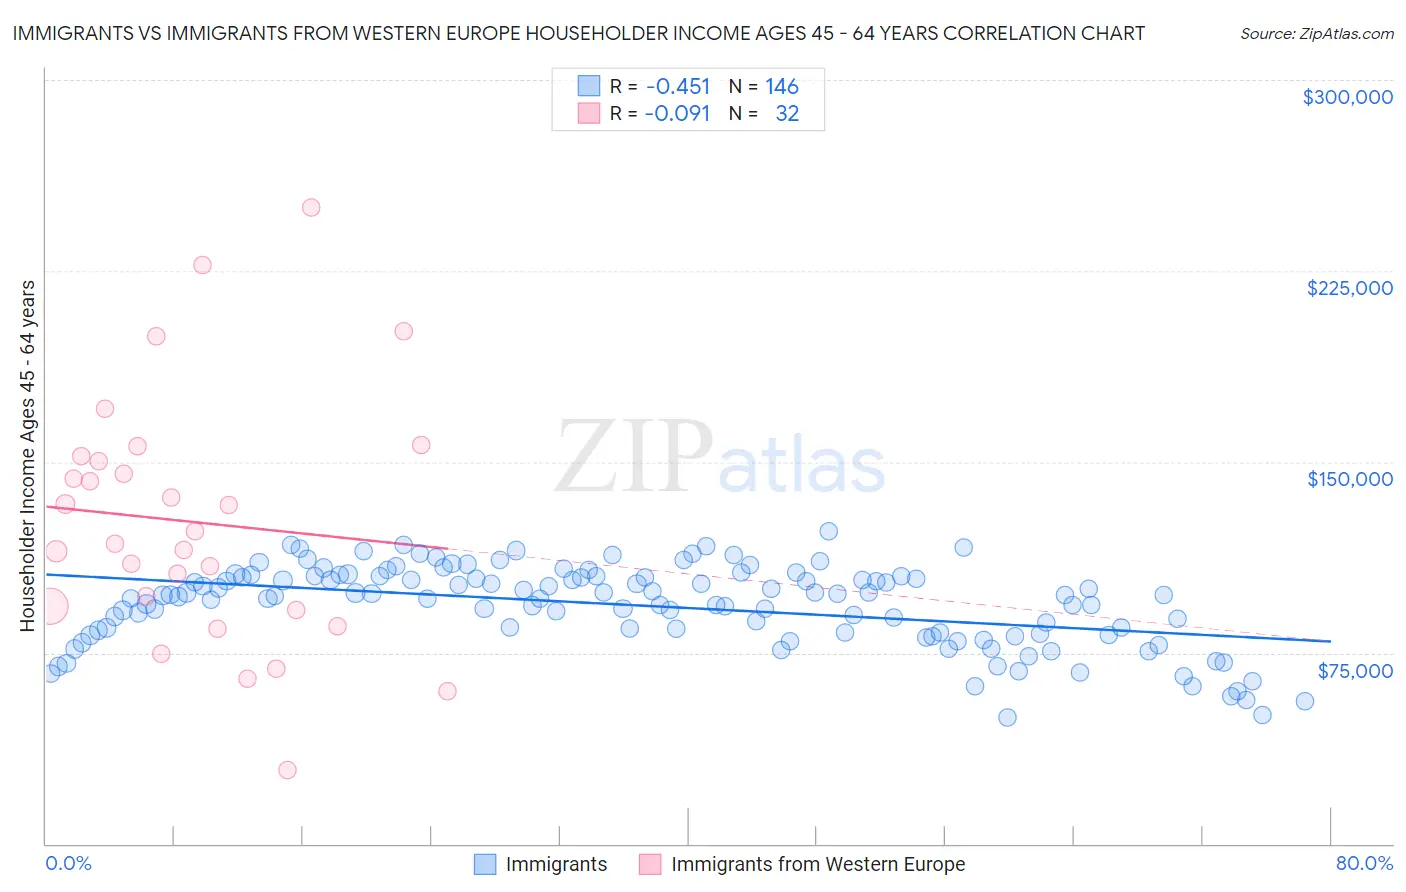
Immigrants vs Immigrants from Western Europe Householder Income Ages 45 - 64 years Correlation Chart
The statistical analysis conducted on geographies consisting of 573,032,532 people shows a moderate negative correlation between the proportion of Immigrants and household income with householder between the ages 45 and 64 in the United States with a correlation coefficient (R) of -0.451 and weighted average of $99,943. Similarly, the statistical analysis conducted on geographies consisting of 492,840,606 people shows a slight negative correlation between the proportion of Immigrants from Western Europe and household income with householder between the ages 45 and 64 in the United States with a correlation coefficient (R) of -0.091 and weighted average of $108,824, a difference of 8.9%.
Householder Income Ages 45 - 64 years Correlation Summary
| Measurement | Immigrants | Immigrants from Western Europe |
| Minimum | $49,742 | $28,859 |
| Maximum | $122,626 | $250,001 |
| Range | $72,884 | $221,142 |
| Mean | $93,603 | $126,348 |
| Median | $97,670 | $120,399 |
| Interquartile 25% (IQ1) | $82,744 | $92,693 |
| Interquartile 75% (IQ3) | $104,952 | $151,414 |
| Interquartile Range (IQR) | $22,209 | $58,721 |
| Standard Deviation (Sample) | $15,834 | $48,876 |
| Standard Deviation (Population) | $15,779 | $48,106 |
Similar Demographics by Householder Income Ages 45 - 64 years
Demographics Similar to Immigrants by Householder Income Ages 45 - 64 years
In terms of householder income ages 45 - 64 years, the demographic groups most similar to Immigrants are Finnish ($99,904, a difference of 0.040%), Spaniard ($99,889, a difference of 0.050%), Aleut ($100,052, a difference of 0.11%), Belgian ($100,060, a difference of 0.12%), and French ($99,824, a difference of 0.12%).
| Demographics | Rating | Rank | Householder Income Ages 45 - 64 years |
| Welsh | 50.0 /100 | #174 | Average $100,322 |
| Germans | 48.8 /100 | #175 | Average $100,224 |
| Immigrants | Costa Rica | 47.7 /100 | #176 | Average $100,141 |
| Moroccans | 47.7 /100 | #177 | Average $100,138 |
| Immigrants | Cameroon | 47.0 /100 | #178 | Average $100,084 |
| Belgians | 46.7 /100 | #179 | Average $100,060 |
| Aleuts | 46.6 /100 | #180 | Average $100,052 |
| Immigrants | Immigrants | 45.3 /100 | #181 | Average $99,943 |
| Finns | 44.8 /100 | #182 | Average $99,904 |
| Spaniards | 44.6 /100 | #183 | Average $99,889 |
| French | 43.8 /100 | #184 | Average $99,824 |
| Colombians | 43.2 /100 | #185 | Average $99,772 |
| Dutch | 41.7 /100 | #186 | Average $99,650 |
| Iraqis | 38.5 /100 | #187 | Fair $99,387 |
| Immigrants | Portugal | 36.3 /100 | #188 | Fair $99,203 |
Demographics Similar to Immigrants from Western Europe by Householder Income Ages 45 - 64 years
In terms of householder income ages 45 - 64 years, the demographic groups most similar to Immigrants from Western Europe are Immigrants from Afghanistan ($108,785, a difference of 0.040%), Austrian ($108,692, a difference of 0.12%), Tongan ($108,643, a difference of 0.17%), Romanian ($108,609, a difference of 0.20%), and Immigrants from Spain ($109,051, a difference of 0.21%).
| Demographics | Rating | Rank | Householder Income Ages 45 - 64 years |
| Immigrants | England | 99.0 /100 | #77 | Exceptional $109,446 |
| Immigrants | Canada | 99.0 /100 | #78 | Exceptional $109,402 |
| Immigrants | Bulgaria | 98.9 /100 | #79 | Exceptional $109,379 |
| Jordanians | 98.9 /100 | #80 | Exceptional $109,376 |
| Immigrants | Eastern Europe | 98.9 /100 | #81 | Exceptional $109,335 |
| Immigrants | North America | 98.8 /100 | #82 | Exceptional $109,198 |
| Immigrants | Spain | 98.8 /100 | #83 | Exceptional $109,051 |
| Immigrants | Western Europe | 98.6 /100 | #84 | Exceptional $108,824 |
| Immigrants | Afghanistan | 98.6 /100 | #85 | Exceptional $108,785 |
| Austrians | 98.5 /100 | #86 | Exceptional $108,692 |
| Tongans | 98.5 /100 | #87 | Exceptional $108,643 |
| Romanians | 98.5 /100 | #88 | Exceptional $108,609 |
| Ukrainians | 98.3 /100 | #89 | Exceptional $108,475 |
| Immigrants | Philippines | 98.3 /100 | #90 | Exceptional $108,471 |
| Immigrants | Lebanon | 98.3 /100 | #91 | Exceptional $108,471 |