Immigrants vs Immigrants from Scotland 7th Grade
COMPARE
Immigrants
Immigrants from Scotland
7th Grade
7th Grade Comparison
Immigrants
Immigrants from Scotland
94.0%
7TH GRADE
0.0/ 100
METRIC RATING
312th/ 347
METRIC RANK
97.1%
7TH GRADE
99.9/ 100
METRIC RATING
50th/ 347
METRIC RANK
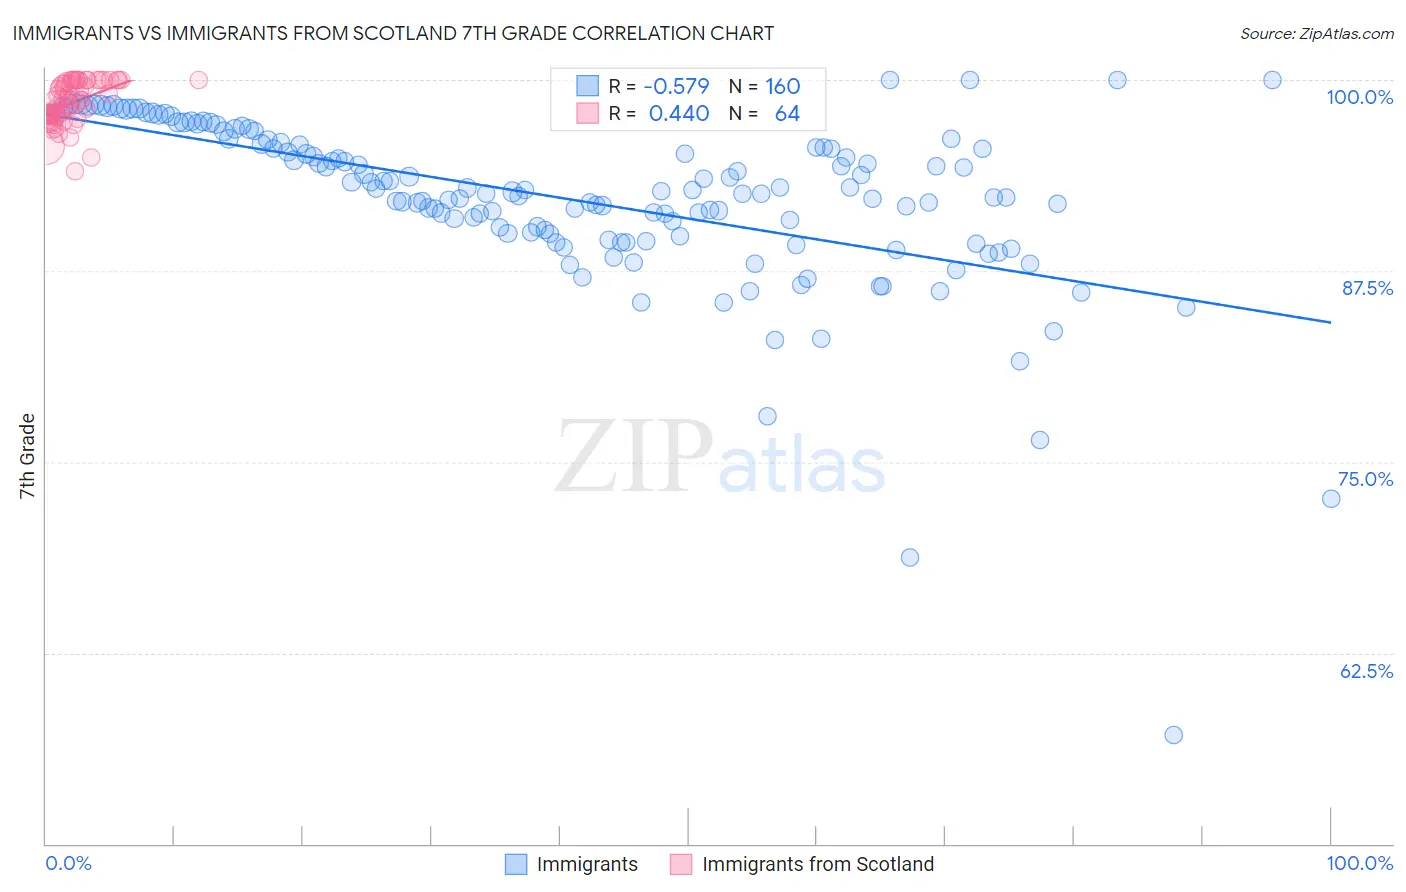
Immigrants vs Immigrants from Scotland 7th Grade Correlation Chart
The statistical analysis conducted on geographies consisting of 577,787,402 people shows a substantial negative correlation between the proportion of Immigrants and percentage of population with at least 7th grade education in the United States with a correlation coefficient (R) of -0.579 and weighted average of 94.0%. Similarly, the statistical analysis conducted on geographies consisting of 196,398,887 people shows a moderate positive correlation between the proportion of Immigrants from Scotland and percentage of population with at least 7th grade education in the United States with a correlation coefficient (R) of 0.440 and weighted average of 97.1%, a difference of 3.3%.
7th Grade Correlation Summary
| Measurement | Immigrants | Immigrants from Scotland |
| Minimum | 57.2% | 94.0% |
| Maximum | 100.0% | 100.0% |
| Range | 42.8% | 6.0% |
| Mean | 92.2% | 98.5% |
| Median | 92.7% | 98.7% |
| Interquartile 25% (IQ1) | 90.0% | 97.6% |
| Interquartile 75% (IQ3) | 95.8% | 100.0% |
| Interquartile Range (IQR) | 5.9% | 2.4% |
| Standard Deviation (Sample) | 5.7% | 1.4% |
| Standard Deviation (Population) | 5.7% | 1.4% |
Similar Demographics by 7th Grade
Demographics Similar to Immigrants by 7th Grade
In terms of 7th grade, the demographic groups most similar to Immigrants are Immigrants from Bangladesh (94.0%, a difference of 0.0%), Japanese (94.0%, a difference of 0.030%), Puerto Rican (94.0%, a difference of 0.040%), Immigrants from Caribbean (94.0%, a difference of 0.050%), and Ecuadorian (94.0%, a difference of 0.060%).
| Demographics | Rating | Rank | 7th Grade |
| Guyanese | 0.0 /100 | #305 | Tragic 94.3% |
| Immigrants | Guyana | 0.0 /100 | #306 | Tragic 94.2% |
| Immigrants | Portugal | 0.0 /100 | #307 | Tragic 94.2% |
| Cape Verdeans | 0.0 /100 | #308 | Tragic 94.1% |
| Ecuadorians | 0.0 /100 | #309 | Tragic 94.0% |
| Immigrants | Caribbean | 0.0 /100 | #310 | Tragic 94.0% |
| Puerto Ricans | 0.0 /100 | #311 | Tragic 94.0% |
| Immigrants | Immigrants | 0.0 /100 | #312 | Tragic 94.0% |
| Immigrants | Bangladesh | 0.0 /100 | #313 | Tragic 94.0% |
| Japanese | 0.0 /100 | #314 | Tragic 94.0% |
| Vietnamese | 0.0 /100 | #315 | Tragic 93.9% |
| Immigrants | Vietnam | 0.0 /100 | #316 | Tragic 93.9% |
| Immigrants | Cuba | 0.0 /100 | #317 | Tragic 93.8% |
| Immigrants | Ecuador | 0.0 /100 | #318 | Tragic 93.7% |
| Immigrants | Cambodia | 0.0 /100 | #319 | Tragic 93.7% |
Demographics Similar to Immigrants from Scotland by 7th Grade
In terms of 7th grade, the demographic groups most similar to Immigrants from Scotland are Slavic (97.1%, a difference of 0.0%), Celtic (97.1%, a difference of 0.010%), Bulgarian (97.1%, a difference of 0.020%), Estonian (97.0%, a difference of 0.030%), and Czechoslovakian (97.1%, a difference of 0.040%).
| Demographics | Rating | Rank | 7th Grade |
| Maltese | 99.9 /100 | #43 | Exceptional 97.1% |
| Northern Europeans | 99.9 /100 | #44 | Exceptional 97.1% |
| Czechoslovakians | 99.9 /100 | #45 | Exceptional 97.1% |
| Aleuts | 99.9 /100 | #46 | Exceptional 97.1% |
| Bulgarians | 99.9 /100 | #47 | Exceptional 97.1% |
| Celtics | 99.9 /100 | #48 | Exceptional 97.1% |
| Slavs | 99.9 /100 | #49 | Exceptional 97.1% |
| Immigrants | Scotland | 99.9 /100 | #50 | Exceptional 97.1% |
| Estonians | 99.9 /100 | #51 | Exceptional 97.0% |
| Greeks | 99.9 /100 | #52 | Exceptional 97.0% |
| Austrians | 99.8 /100 | #53 | Exceptional 97.0% |
| Australians | 99.8 /100 | #54 | Exceptional 97.0% |
| Russians | 99.8 /100 | #55 | Exceptional 97.0% |
| Serbians | 99.8 /100 | #56 | Exceptional 97.0% |
| Americans | 99.8 /100 | #57 | Exceptional 97.0% |