Immigrants from El Salvador vs Immigrants from Scotland Householder Income Ages 45 - 64 years
COMPARE
Immigrants from El Salvador
Immigrants from Scotland
Householder Income Ages 45 - 64 years
Householder Income Ages 45 - 64 years Comparison
Immigrants from El Salvador
Immigrants from Scotland
$93,176
HOUSEHOLDER INCOME AGES 45 - 64 YEARS
2.7/ 100
METRIC RATING
234th/ 347
METRIC RANK
$112,175
HOUSEHOLDER INCOME AGES 45 - 64 YEARS
99.7/ 100
METRIC RATING
57th/ 347
METRIC RANK
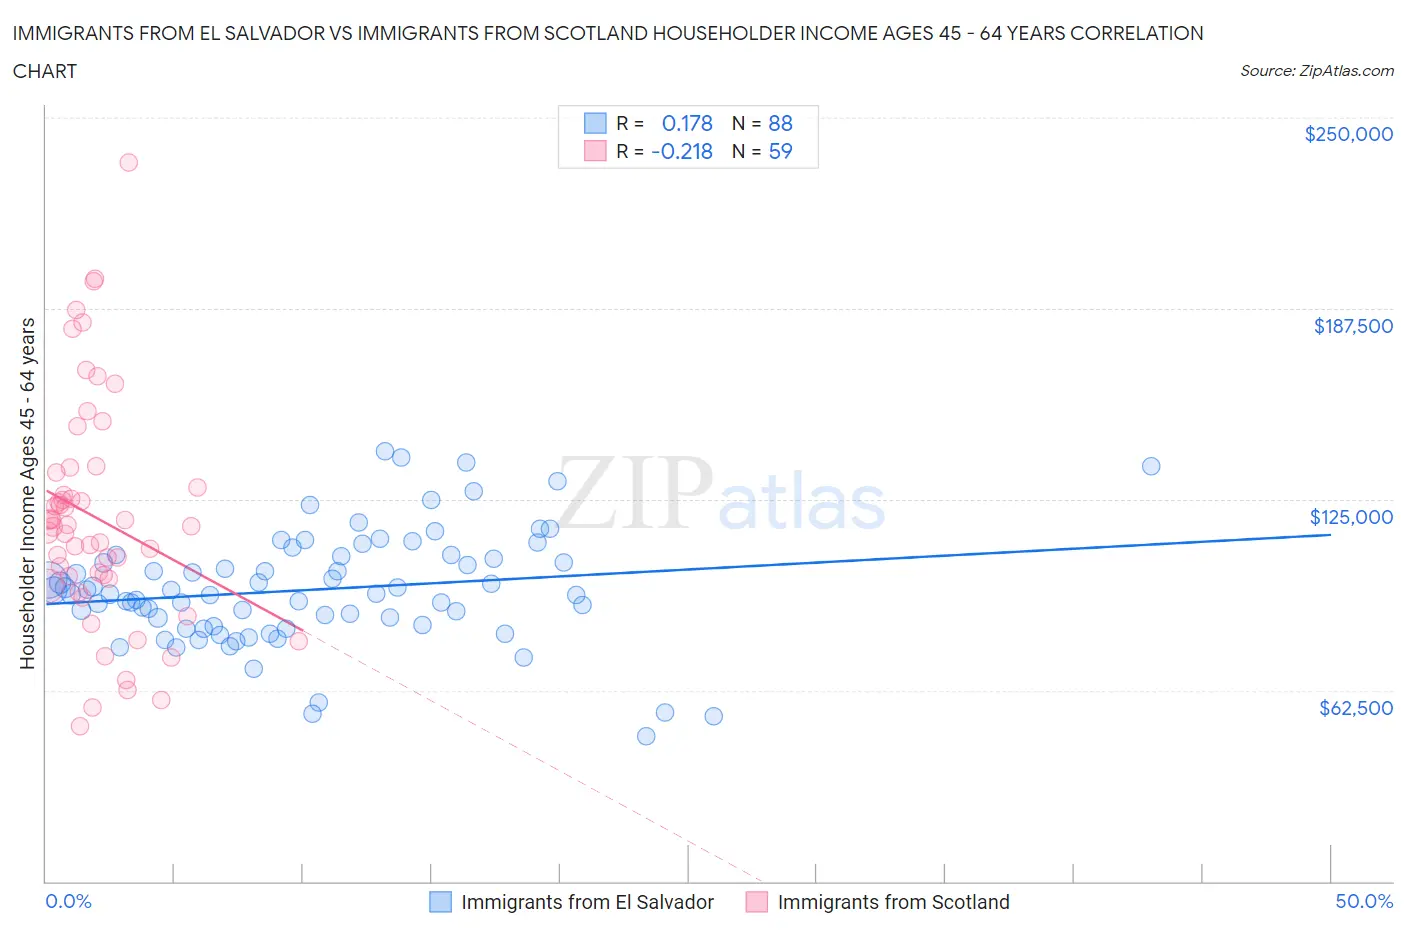
Immigrants from El Salvador vs Immigrants from Scotland Householder Income Ages 45 - 64 years Correlation Chart
The statistical analysis conducted on geographies consisting of 357,351,830 people shows a poor positive correlation between the proportion of Immigrants from El Salvador and household income with householder between the ages 45 and 64 in the United States with a correlation coefficient (R) of 0.178 and weighted average of $93,176. Similarly, the statistical analysis conducted on geographies consisting of 196,306,060 people shows a weak negative correlation between the proportion of Immigrants from Scotland and household income with householder between the ages 45 and 64 in the United States with a correlation coefficient (R) of -0.218 and weighted average of $112,175, a difference of 20.4%.
Householder Income Ages 45 - 64 years Correlation Summary
| Measurement | Immigrants from El Salvador | Immigrants from Scotland |
| Minimum | $47,339 | $50,625 |
| Maximum | $140,748 | $235,104 |
| Range | $93,409 | $184,479 |
| Mean | $95,436 | $119,000 |
| Median | $94,032 | $116,045 |
| Interquartile 25% (IQ1) | $83,646 | $99,167 |
| Interquartile 75% (IQ3) | $106,007 | $133,636 |
| Interquartile Range (IQR) | $22,361 | $34,469 |
| Standard Deviation (Sample) | $18,513 | $37,312 |
| Standard Deviation (Population) | $18,408 | $36,994 |
Similar Demographics by Householder Income Ages 45 - 64 years
Demographics Similar to Immigrants from El Salvador by Householder Income Ages 45 - 64 years
In terms of householder income ages 45 - 64 years, the demographic groups most similar to Immigrants from El Salvador are Nepalese ($93,355, a difference of 0.19%), Sudanese ($93,718, a difference of 0.58%), Ecuadorian ($93,739, a difference of 0.60%), Immigrants from Sudan ($93,781, a difference of 0.65%), and Vietnamese ($93,788, a difference of 0.66%).
| Demographics | Rating | Rank | Householder Income Ages 45 - 64 years |
| Alaska Natives | 4.0 /100 | #227 | Tragic $93,991 |
| Immigrants | Panama | 3.7 /100 | #228 | Tragic $93,815 |
| Vietnamese | 3.6 /100 | #229 | Tragic $93,788 |
| Immigrants | Sudan | 3.6 /100 | #230 | Tragic $93,781 |
| Ecuadorians | 3.6 /100 | #231 | Tragic $93,739 |
| Sudanese | 3.5 /100 | #232 | Tragic $93,718 |
| Nepalese | 3.0 /100 | #233 | Tragic $93,355 |
| Immigrants | El Salvador | 2.7 /100 | #234 | Tragic $93,176 |
| Nicaraguans | 2.0 /100 | #235 | Tragic $92,554 |
| Immigrants | Western Africa | 1.8 /100 | #236 | Tragic $92,384 |
| Immigrants | Bangladesh | 1.7 /100 | #237 | Tragic $92,208 |
| Pennsylvania Germans | 1.5 /100 | #238 | Tragic $91,956 |
| Immigrants | Ecuador | 1.2 /100 | #239 | Tragic $91,462 |
| Immigrants | Burma/Myanmar | 1.1 /100 | #240 | Tragic $91,385 |
| Trinidadians and Tobagonians | 1.1 /100 | #241 | Tragic $91,357 |
Demographics Similar to Immigrants from Scotland by Householder Income Ages 45 - 64 years
In terms of householder income ages 45 - 64 years, the demographic groups most similar to Immigrants from Scotland are Egyptian ($112,256, a difference of 0.070%), Soviet Union ($112,008, a difference of 0.15%), Immigrants from Europe ($111,984, a difference of 0.17%), Immigrants from Netherlands ($111,982, a difference of 0.17%), and Immigrants from Czechoslovakia ($111,914, a difference of 0.23%).
| Demographics | Rating | Rank | Householder Income Ages 45 - 64 years |
| Immigrants | Austria | 99.8 /100 | #50 | Exceptional $113,140 |
| Immigrants | South Africa | 99.8 /100 | #51 | Exceptional $112,886 |
| Immigrants | Malaysia | 99.8 /100 | #52 | Exceptional $112,796 |
| Afghans | 99.8 /100 | #53 | Exceptional $112,676 |
| Greeks | 99.8 /100 | #54 | Exceptional $112,630 |
| Lithuanians | 99.8 /100 | #55 | Exceptional $112,484 |
| Egyptians | 99.7 /100 | #56 | Exceptional $112,256 |
| Immigrants | Scotland | 99.7 /100 | #57 | Exceptional $112,175 |
| Soviet Union | 99.7 /100 | #58 | Exceptional $112,008 |
| Immigrants | Europe | 99.7 /100 | #59 | Exceptional $111,984 |
| Immigrants | Netherlands | 99.7 /100 | #60 | Exceptional $111,982 |
| Immigrants | Czechoslovakia | 99.7 /100 | #61 | Exceptional $111,914 |
| Immigrants | Norway | 99.7 /100 | #62 | Exceptional $111,669 |
| Mongolians | 99.6 /100 | #63 | Exceptional $111,602 |
| Immigrants | Latvia | 99.6 /100 | #64 | Exceptional $111,454 |