Immigrants vs Haitian Householder Income Ages 45 - 64 years
COMPARE
Immigrants
Haitian
Householder Income Ages 45 - 64 years
Householder Income Ages 45 - 64 years Comparison
Immigrants
Haitians
$99,943
HOUSEHOLDER INCOME AGES 45 - 64 YEARS
45.3/ 100
METRIC RATING
181st/ 347
METRIC RANK
$84,384
HOUSEHOLDER INCOME AGES 45 - 64 YEARS
0.0/ 100
METRIC RATING
302nd/ 347
METRIC RANK
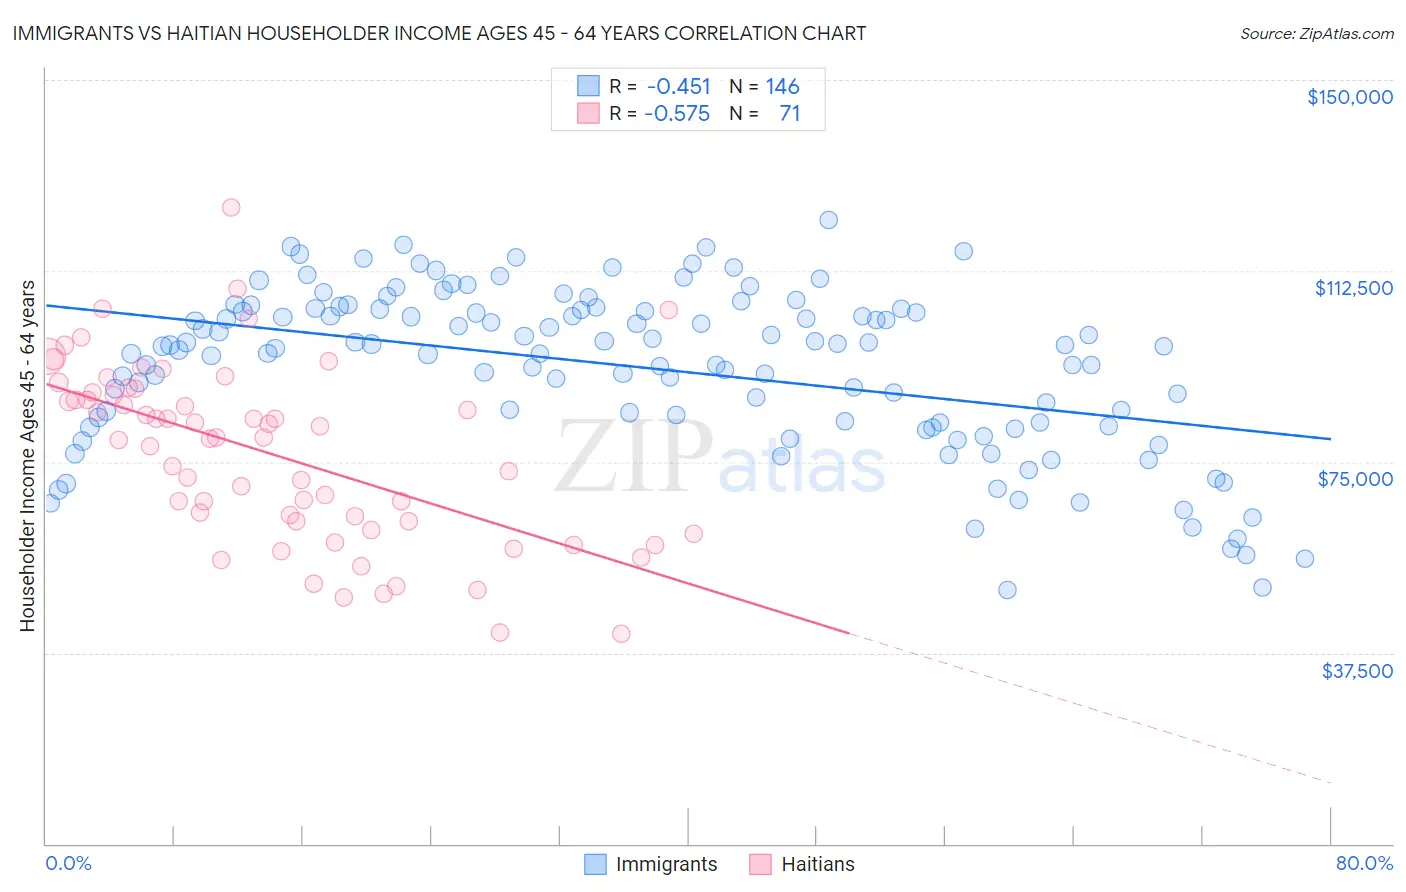
Immigrants vs Haitian Householder Income Ages 45 - 64 years Correlation Chart
The statistical analysis conducted on geographies consisting of 573,032,532 people shows a moderate negative correlation between the proportion of Immigrants and household income with householder between the ages 45 and 64 in the United States with a correlation coefficient (R) of -0.451 and weighted average of $99,943. Similarly, the statistical analysis conducted on geographies consisting of 287,353,050 people shows a substantial negative correlation between the proportion of Haitians and household income with householder between the ages 45 and 64 in the United States with a correlation coefficient (R) of -0.575 and weighted average of $84,384, a difference of 18.4%.
Householder Income Ages 45 - 64 years Correlation Summary
| Measurement | Immigrants | Haitian |
| Minimum | $49,742 | $41,306 |
| Maximum | $122,626 | $125,012 |
| Range | $72,884 | $83,706 |
| Mean | $93,603 | $76,677 |
| Median | $97,670 | $79,782 |
| Interquartile 25% (IQ1) | $82,744 | $63,219 |
| Interquartile 75% (IQ3) | $104,952 | $88,532 |
| Interquartile Range (IQR) | $22,209 | $25,313 |
| Standard Deviation (Sample) | $15,834 | $17,503 |
| Standard Deviation (Population) | $15,779 | $17,379 |
Similar Demographics by Householder Income Ages 45 - 64 years
Demographics Similar to Immigrants by Householder Income Ages 45 - 64 years
In terms of householder income ages 45 - 64 years, the demographic groups most similar to Immigrants are Finnish ($99,904, a difference of 0.040%), Spaniard ($99,889, a difference of 0.050%), Aleut ($100,052, a difference of 0.11%), Belgian ($100,060, a difference of 0.12%), and French ($99,824, a difference of 0.12%).
| Demographics | Rating | Rank | Householder Income Ages 45 - 64 years |
| Welsh | 50.0 /100 | #174 | Average $100,322 |
| Germans | 48.8 /100 | #175 | Average $100,224 |
| Immigrants | Costa Rica | 47.7 /100 | #176 | Average $100,141 |
| Moroccans | 47.7 /100 | #177 | Average $100,138 |
| Immigrants | Cameroon | 47.0 /100 | #178 | Average $100,084 |
| Belgians | 46.7 /100 | #179 | Average $100,060 |
| Aleuts | 46.6 /100 | #180 | Average $100,052 |
| Immigrants | Immigrants | 45.3 /100 | #181 | Average $99,943 |
| Finns | 44.8 /100 | #182 | Average $99,904 |
| Spaniards | 44.6 /100 | #183 | Average $99,889 |
| French | 43.8 /100 | #184 | Average $99,824 |
| Colombians | 43.2 /100 | #185 | Average $99,772 |
| Dutch | 41.7 /100 | #186 | Average $99,650 |
| Iraqis | 38.5 /100 | #187 | Fair $99,387 |
| Immigrants | Portugal | 36.3 /100 | #188 | Fair $99,203 |
Demographics Similar to Haitians by Householder Income Ages 45 - 64 years
In terms of householder income ages 45 - 64 years, the demographic groups most similar to Haitians are Potawatomi ($84,613, a difference of 0.27%), Honduran ($84,079, a difference of 0.36%), Ottawa ($83,953, a difference of 0.51%), Chippewa ($83,943, a difference of 0.52%), and Ute ($83,937, a difference of 0.53%).
| Demographics | Rating | Rank | Householder Income Ages 45 - 64 years |
| Immigrants | Grenada | 0.1 /100 | #295 | Tragic $85,552 |
| Immigrants | Zaire | 0.1 /100 | #296 | Tragic $85,207 |
| Fijians | 0.1 /100 | #297 | Tragic $85,187 |
| Africans | 0.0 /100 | #298 | Tragic $84,925 |
| Immigrants | Mexico | 0.0 /100 | #299 | Tragic $84,910 |
| Indonesians | 0.0 /100 | #300 | Tragic $84,890 |
| Potawatomi | 0.0 /100 | #301 | Tragic $84,613 |
| Haitians | 0.0 /100 | #302 | Tragic $84,384 |
| Hondurans | 0.0 /100 | #303 | Tragic $84,079 |
| Ottawa | 0.0 /100 | #304 | Tragic $83,953 |
| Chippewa | 0.0 /100 | #305 | Tragic $83,943 |
| Ute | 0.0 /100 | #306 | Tragic $83,937 |
| Shoshone | 0.0 /100 | #307 | Tragic $83,588 |
| Immigrants | Cabo Verde | 0.0 /100 | #308 | Tragic $83,542 |
| Immigrants | Dominica | 0.0 /100 | #309 | Tragic $83,311 |