Arapaho vs Immigrants from Scotland Householder Income Ages 45 - 64 years
COMPARE
Arapaho
Immigrants from Scotland
Householder Income Ages 45 - 64 years
Householder Income Ages 45 - 64 years Comparison
Arapaho
Immigrants from Scotland
$75,945
HOUSEHOLDER INCOME AGES 45 - 64 YEARS
0.0/ 100
METRIC RATING
336th/ 347
METRIC RANK
$112,175
HOUSEHOLDER INCOME AGES 45 - 64 YEARS
99.7/ 100
METRIC RATING
57th/ 347
METRIC RANK
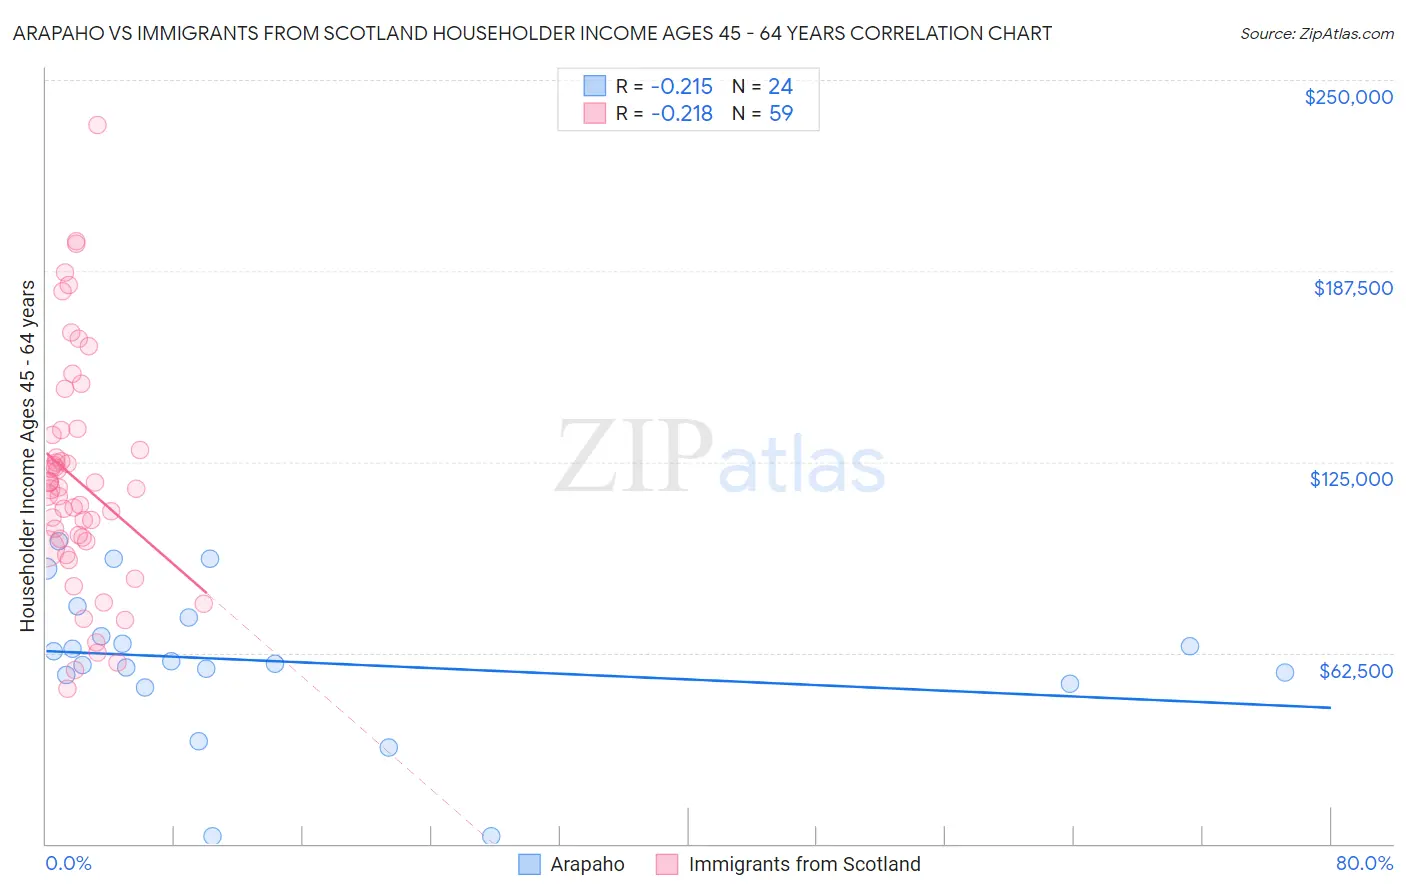
Arapaho vs Immigrants from Scotland Householder Income Ages 45 - 64 years Correlation Chart
The statistical analysis conducted on geographies consisting of 29,759,321 people shows a weak negative correlation between the proportion of Arapaho and household income with householder between the ages 45 and 64 in the United States with a correlation coefficient (R) of -0.215 and weighted average of $75,945. Similarly, the statistical analysis conducted on geographies consisting of 196,306,060 people shows a weak negative correlation between the proportion of Immigrants from Scotland and household income with householder between the ages 45 and 64 in the United States with a correlation coefficient (R) of -0.218 and weighted average of $112,175, a difference of 47.7%.
Householder Income Ages 45 - 64 years Correlation Summary
| Measurement | Arapaho | Immigrants from Scotland |
| Minimum | $2,499 | $50,625 |
| Maximum | $98,945 | $235,104 |
| Range | $96,446 | $184,479 |
| Mean | $59,533 | $119,000 |
| Median | $59,148 | $116,045 |
| Interquartile 25% (IQ1) | $53,794 | $99,167 |
| Interquartile 75% (IQ3) | $70,823 | $133,636 |
| Interquartile Range (IQR) | $17,029 | $34,469 |
| Standard Deviation (Sample) | $24,298 | $37,312 |
| Standard Deviation (Population) | $23,786 | $36,994 |
Similar Demographics by Householder Income Ages 45 - 64 years
Demographics Similar to Arapaho by Householder Income Ages 45 - 64 years
In terms of householder income ages 45 - 64 years, the demographic groups most similar to Arapaho are Pueblo ($75,601, a difference of 0.45%), Hopi ($75,562, a difference of 0.51%), Cheyenne ($76,362, a difference of 0.55%), Menominee ($76,903, a difference of 1.3%), and Kiowa ($74,815, a difference of 1.5%).
| Demographics | Rating | Rank | Householder Income Ages 45 - 64 years |
| Dutch West Indians | 0.0 /100 | #329 | Tragic $79,171 |
| Creek | 0.0 /100 | #330 | Tragic $78,960 |
| Immigrants | Dominican Republic | 0.0 /100 | #331 | Tragic $78,836 |
| Blacks/African Americans | 0.0 /100 | #332 | Tragic $78,556 |
| Immigrants | Congo | 0.0 /100 | #333 | Tragic $77,850 |
| Menominee | 0.0 /100 | #334 | Tragic $76,903 |
| Cheyenne | 0.0 /100 | #335 | Tragic $76,362 |
| Arapaho | 0.0 /100 | #336 | Tragic $75,945 |
| Pueblo | 0.0 /100 | #337 | Tragic $75,601 |
| Hopi | 0.0 /100 | #338 | Tragic $75,562 |
| Kiowa | 0.0 /100 | #339 | Tragic $74,815 |
| Immigrants | Yemen | 0.0 /100 | #340 | Tragic $74,575 |
| Crow | 0.0 /100 | #341 | Tragic $74,257 |
| Tohono O'odham | 0.0 /100 | #342 | Tragic $73,774 |
| Pima | 0.0 /100 | #343 | Tragic $73,365 |
Demographics Similar to Immigrants from Scotland by Householder Income Ages 45 - 64 years
In terms of householder income ages 45 - 64 years, the demographic groups most similar to Immigrants from Scotland are Egyptian ($112,256, a difference of 0.070%), Soviet Union ($112,008, a difference of 0.15%), Immigrants from Europe ($111,984, a difference of 0.17%), Immigrants from Netherlands ($111,982, a difference of 0.17%), and Immigrants from Czechoslovakia ($111,914, a difference of 0.23%).
| Demographics | Rating | Rank | Householder Income Ages 45 - 64 years |
| Immigrants | Austria | 99.8 /100 | #50 | Exceptional $113,140 |
| Immigrants | South Africa | 99.8 /100 | #51 | Exceptional $112,886 |
| Immigrants | Malaysia | 99.8 /100 | #52 | Exceptional $112,796 |
| Afghans | 99.8 /100 | #53 | Exceptional $112,676 |
| Greeks | 99.8 /100 | #54 | Exceptional $112,630 |
| Lithuanians | 99.8 /100 | #55 | Exceptional $112,484 |
| Egyptians | 99.7 /100 | #56 | Exceptional $112,256 |
| Immigrants | Scotland | 99.7 /100 | #57 | Exceptional $112,175 |
| Soviet Union | 99.7 /100 | #58 | Exceptional $112,008 |
| Immigrants | Europe | 99.7 /100 | #59 | Exceptional $111,984 |
| Immigrants | Netherlands | 99.7 /100 | #60 | Exceptional $111,982 |
| Immigrants | Czechoslovakia | 99.7 /100 | #61 | Exceptional $111,914 |
| Immigrants | Norway | 99.7 /100 | #62 | Exceptional $111,669 |
| Mongolians | 99.6 /100 | #63 | Exceptional $111,602 |
| Immigrants | Latvia | 99.6 /100 | #64 | Exceptional $111,454 |