Tohono O'odham vs Fijian Median Earnings
COMPARE
Tohono O'odham
Fijian
Median Earnings
Median Earnings Comparison
Tohono O'odham
Fijians
$36,349
MEDIAN EARNINGS
0.0/ 100
METRIC RATING
345th/ 347
METRIC RANK
$40,193
MEDIAN EARNINGS
0.0/ 100
METRIC RATING
317th/ 347
METRIC RANK
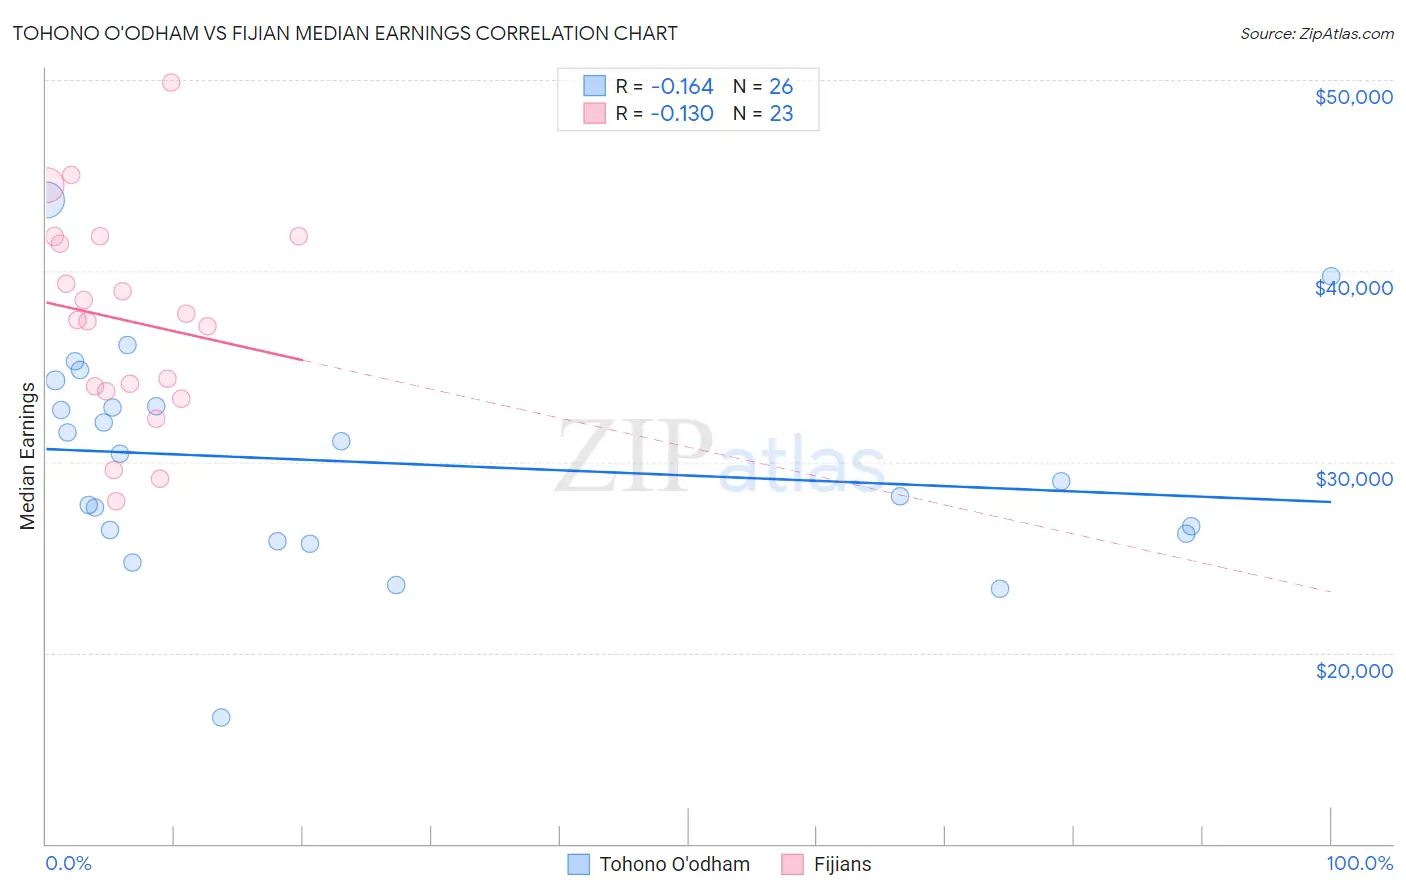
Tohono O'odham vs Fijian Median Earnings Correlation Chart
The statistical analysis conducted on geographies consisting of 58,728,293 people shows a poor negative correlation between the proportion of Tohono O'odham and median earnings in the United States with a correlation coefficient (R) of -0.164 and weighted average of $36,349. Similarly, the statistical analysis conducted on geographies consisting of 55,947,867 people shows a poor negative correlation between the proportion of Fijians and median earnings in the United States with a correlation coefficient (R) of -0.130 and weighted average of $40,193, a difference of 10.6%.
Median Earnings Correlation Summary
| Measurement | Tohono O'odham | Fijian |
| Minimum | $16,641 | $27,917 |
| Maximum | $43,705 | $49,875 |
| Range | $27,064 | $21,958 |
| Mean | $29,971 | $37,430 |
| Median | $29,707 | $37,445 |
| Interquartile 25% (IQ1) | $26,250 | $33,695 |
| Interquartile 75% (IQ3) | $32,909 | $41,805 |
| Interquartile Range (IQR) | $6,659 | $8,109 |
| Standard Deviation (Sample) | $5,663 | $5,451 |
| Standard Deviation (Population) | $5,553 | $5,331 |
Similar Demographics by Median Earnings
Demographics Similar to Tohono O'odham by Median Earnings
In terms of median earnings, the demographic groups most similar to Tohono O'odham are Arapaho ($36,586, a difference of 0.65%), Yup'ik ($35,942, a difference of 1.1%), Pueblo ($36,859, a difference of 1.4%), Hopi ($36,871, a difference of 1.4%), and Lumbee ($36,876, a difference of 1.5%).
| Demographics | Rating | Rank | Median Earnings |
| Houma | 0.0 /100 | #333 | Tragic $38,949 |
| Spanish American Indians | 0.0 /100 | #334 | Tragic $38,907 |
| Natives/Alaskans | 0.0 /100 | #335 | Tragic $38,896 |
| Crow | 0.0 /100 | #336 | Tragic $38,707 |
| Immigrants | Cuba | 0.0 /100 | #337 | Tragic $38,426 |
| Pima | 0.0 /100 | #338 | Tragic $38,285 |
| Menominee | 0.0 /100 | #339 | Tragic $37,884 |
| Navajo | 0.0 /100 | #340 | Tragic $36,999 |
| Lumbee | 0.0 /100 | #341 | Tragic $36,876 |
| Hopi | 0.0 /100 | #342 | Tragic $36,871 |
| Pueblo | 0.0 /100 | #343 | Tragic $36,859 |
| Arapaho | 0.0 /100 | #344 | Tragic $36,586 |
| Tohono O'odham | 0.0 /100 | #345 | Tragic $36,349 |
| Yup'ik | 0.0 /100 | #346 | Tragic $35,942 |
| Puerto Ricans | 0.0 /100 | #347 | Tragic $35,560 |
Demographics Similar to Fijians by Median Earnings
In terms of median earnings, the demographic groups most similar to Fijians are Immigrants from Honduras ($40,195, a difference of 0.0%), Cheyenne ($40,233, a difference of 0.10%), Seminole ($40,233, a difference of 0.10%), Choctaw ($40,270, a difference of 0.19%), and Dutch West Indian ($40,107, a difference of 0.21%).
| Demographics | Rating | Rank | Median Earnings |
| Apache | 0.0 /100 | #310 | Tragic $40,388 |
| Hispanics or Latinos | 0.0 /100 | #311 | Tragic $40,288 |
| Chippewa | 0.0 /100 | #312 | Tragic $40,287 |
| Choctaw | 0.0 /100 | #313 | Tragic $40,270 |
| Cheyenne | 0.0 /100 | #314 | Tragic $40,233 |
| Seminole | 0.0 /100 | #315 | Tragic $40,233 |
| Immigrants | Honduras | 0.0 /100 | #316 | Tragic $40,195 |
| Fijians | 0.0 /100 | #317 | Tragic $40,193 |
| Dutch West Indians | 0.0 /100 | #318 | Tragic $40,107 |
| Blacks/African Americans | 0.0 /100 | #319 | Tragic $40,085 |
| Immigrants | Bahamas | 0.0 /100 | #320 | Tragic $39,861 |
| Mexicans | 0.0 /100 | #321 | Tragic $39,834 |
| Immigrants | Central America | 0.0 /100 | #322 | Tragic $39,762 |
| Bahamians | 0.0 /100 | #323 | Tragic $39,735 |
| Ottawa | 0.0 /100 | #324 | Tragic $39,721 |