Barbadian vs Fijian Median Earnings
COMPARE
Barbadian
Fijian
Median Earnings
Median Earnings Comparison
Barbadians
Fijians
$45,846
MEDIAN EARNINGS
30.5/ 100
METRIC RATING
197th/ 347
METRIC RANK
$40,193
MEDIAN EARNINGS
0.0/ 100
METRIC RATING
317th/ 347
METRIC RANK
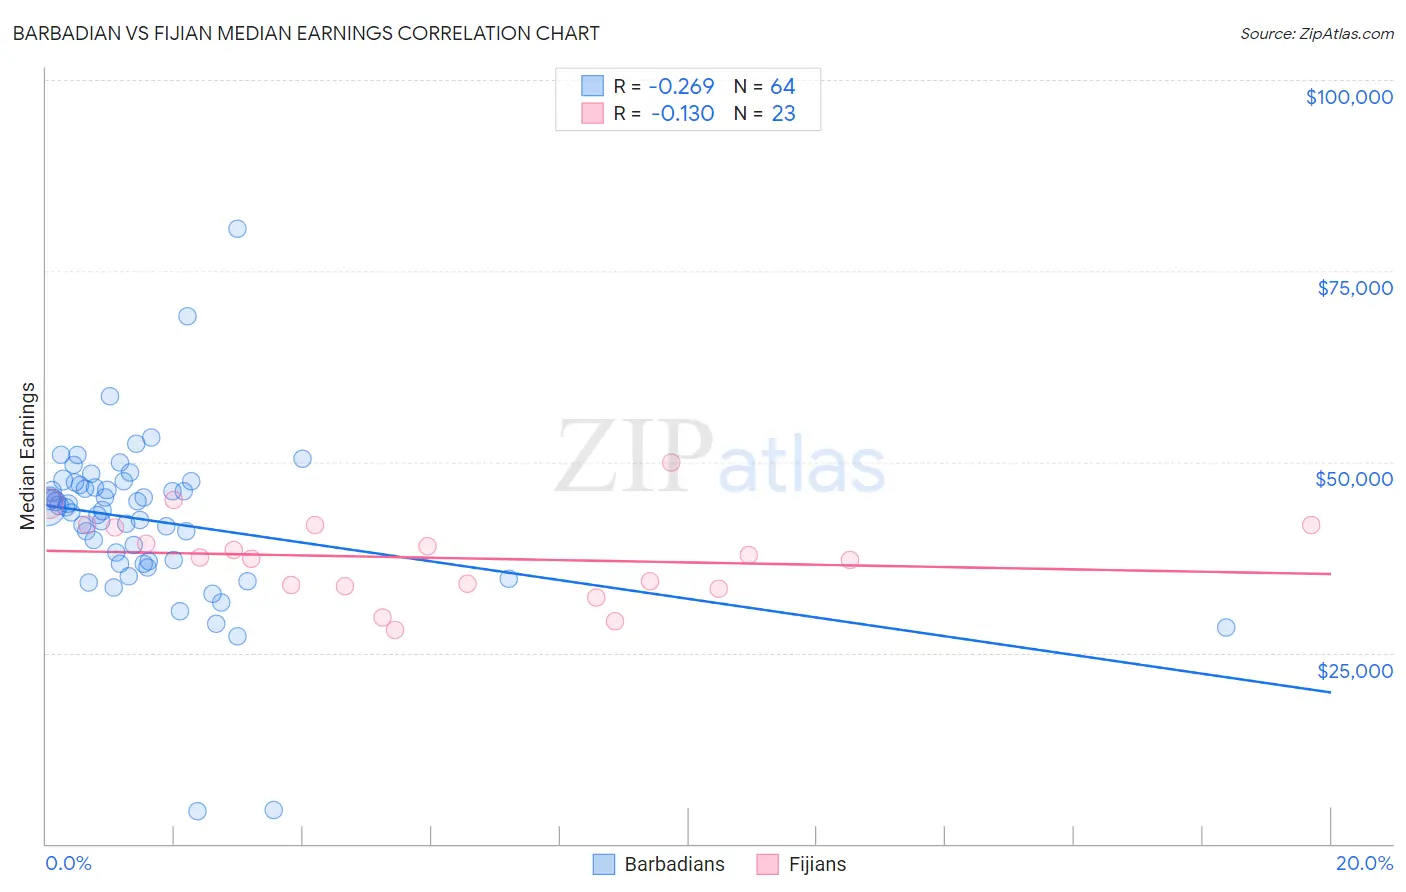
Barbadian vs Fijian Median Earnings Correlation Chart
The statistical analysis conducted on geographies consisting of 141,267,085 people shows a weak negative correlation between the proportion of Barbadians and median earnings in the United States with a correlation coefficient (R) of -0.269 and weighted average of $45,846. Similarly, the statistical analysis conducted on geographies consisting of 55,947,867 people shows a poor negative correlation between the proportion of Fijians and median earnings in the United States with a correlation coefficient (R) of -0.130 and weighted average of $40,193, a difference of 14.1%.
Median Earnings Correlation Summary
| Measurement | Barbadian | Fijian |
| Minimum | $4,250 | $27,917 |
| Maximum | $80,575 | $49,875 |
| Range | $76,325 | $21,958 |
| Mean | $42,285 | $37,430 |
| Median | $44,059 | $37,445 |
| Interquartile 25% (IQ1) | $36,766 | $33,695 |
| Interquartile 75% (IQ3) | $47,124 | $41,805 |
| Interquartile Range (IQR) | $10,358 | $8,109 |
| Standard Deviation (Sample) | $11,063 | $5,451 |
| Standard Deviation (Population) | $10,976 | $5,331 |
Similar Demographics by Median Earnings
Demographics Similar to Barbadians by Median Earnings
In terms of median earnings, the demographic groups most similar to Barbadians are Yugoslavian ($45,846, a difference of 0.0%), Trinidadian and Tobagonian ($45,820, a difference of 0.060%), Immigrants from Barbados ($45,816, a difference of 0.060%), Immigrants from the Azores ($45,812, a difference of 0.070%), and Immigrants from St. Vincent and the Grenadines ($45,908, a difference of 0.14%).
| Demographics | Rating | Rank | Median Earnings |
| French Canadians | 36.1 /100 | #190 | Fair $46,026 |
| Finns | 33.4 /100 | #191 | Fair $45,940 |
| Germans | 33.2 /100 | #192 | Fair $45,935 |
| Guamanians/Chamorros | 33.2 /100 | #193 | Fair $45,933 |
| Immigrants | Costa Rica | 33.0 /100 | #194 | Fair $45,928 |
| Immigrants | St. Vincent and the Grenadines | 32.4 /100 | #195 | Fair $45,908 |
| Yugoslavians | 30.5 /100 | #196 | Fair $45,846 |
| Barbadians | 30.5 /100 | #197 | Fair $45,846 |
| Trinidadians and Tobagonians | 29.7 /100 | #198 | Fair $45,820 |
| Immigrants | Barbados | 29.6 /100 | #199 | Fair $45,816 |
| Immigrants | Azores | 29.5 /100 | #200 | Fair $45,812 |
| Celtics | 27.2 /100 | #201 | Fair $45,732 |
| Immigrants | Trinidad and Tobago | 27.1 /100 | #202 | Fair $45,729 |
| Welsh | 26.6 /100 | #203 | Fair $45,710 |
| Immigrants | Uruguay | 25.9 /100 | #204 | Fair $45,682 |
Demographics Similar to Fijians by Median Earnings
In terms of median earnings, the demographic groups most similar to Fijians are Immigrants from Honduras ($40,195, a difference of 0.0%), Cheyenne ($40,233, a difference of 0.10%), Seminole ($40,233, a difference of 0.10%), Choctaw ($40,270, a difference of 0.19%), and Dutch West Indian ($40,107, a difference of 0.21%).
| Demographics | Rating | Rank | Median Earnings |
| Apache | 0.0 /100 | #310 | Tragic $40,388 |
| Hispanics or Latinos | 0.0 /100 | #311 | Tragic $40,288 |
| Chippewa | 0.0 /100 | #312 | Tragic $40,287 |
| Choctaw | 0.0 /100 | #313 | Tragic $40,270 |
| Cheyenne | 0.0 /100 | #314 | Tragic $40,233 |
| Seminole | 0.0 /100 | #315 | Tragic $40,233 |
| Immigrants | Honduras | 0.0 /100 | #316 | Tragic $40,195 |
| Fijians | 0.0 /100 | #317 | Tragic $40,193 |
| Dutch West Indians | 0.0 /100 | #318 | Tragic $40,107 |
| Blacks/African Americans | 0.0 /100 | #319 | Tragic $40,085 |
| Immigrants | Bahamas | 0.0 /100 | #320 | Tragic $39,861 |
| Mexicans | 0.0 /100 | #321 | Tragic $39,834 |
| Immigrants | Central America | 0.0 /100 | #322 | Tragic $39,762 |
| Bahamians | 0.0 /100 | #323 | Tragic $39,735 |
| Ottawa | 0.0 /100 | #324 | Tragic $39,721 |