Immigrants from Western Europe vs Alsatian Wage/Income Gap
COMPARE
Immigrants from Western Europe
Alsatian
Wage/Income Gap
Wage/Income Gap Comparison
Immigrants from Western Europe
Alsatians
27.8%
WAGE/INCOME GAP
0.9/ 100
METRIC RATING
270th/ 347
METRIC RANK
24.7%
WAGE/INCOME GAP
93.2/ 100
METRIC RATING
130th/ 347
METRIC RANK
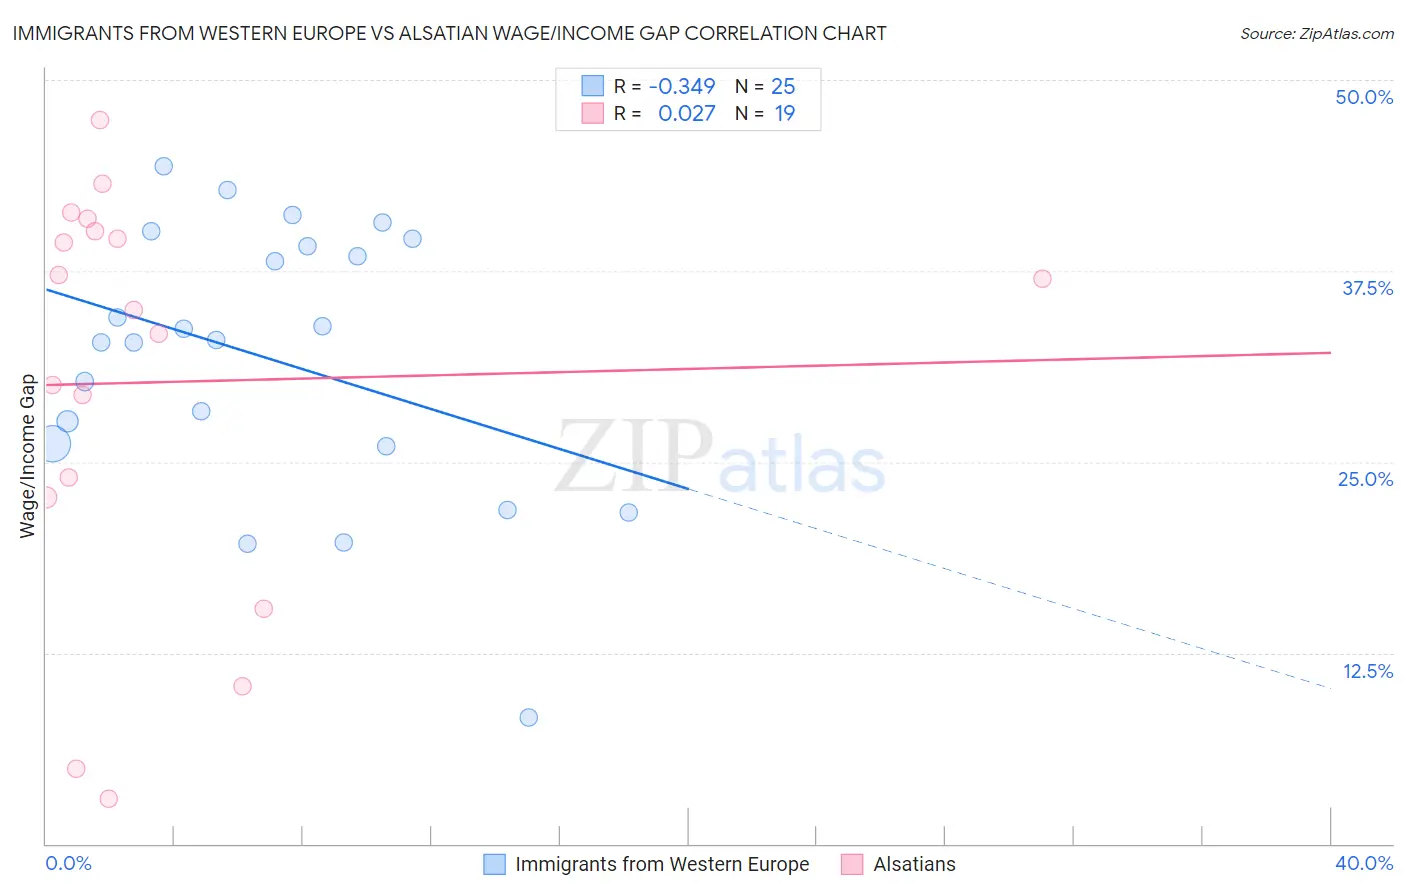
Immigrants from Western Europe vs Alsatian Wage/Income Gap Correlation Chart
The statistical analysis conducted on geographies consisting of 493,207,642 people shows a mild negative correlation between the proportion of Immigrants from Western Europe and wage/income gap percentage in the United States with a correlation coefficient (R) of -0.349 and weighted average of 27.8%. Similarly, the statistical analysis conducted on geographies consisting of 82,663,210 people shows no correlation between the proportion of Alsatians and wage/income gap percentage in the United States with a correlation coefficient (R) of 0.027 and weighted average of 24.7%, a difference of 12.5%.
Wage/Income Gap Correlation Summary
| Measurement | Immigrants from Western Europe | Alsatian |
| Minimum | 8.2% | 3.0% |
| Maximum | 44.3% | 47.4% |
| Range | 36.1% | 44.4% |
| Mean | 31.8% | 30.2% |
| Median | 33.0% | 35.0% |
| Interquartile 25% (IQ1) | 26.1% | 22.7% |
| Interquartile 75% (IQ3) | 39.4% | 40.1% |
| Interquartile Range (IQR) | 13.2% | 17.4% |
| Standard Deviation (Sample) | 8.8% | 13.3% |
| Standard Deviation (Population) | 8.7% | 13.0% |
Similar Demographics by Wage/Income Gap
Demographics Similar to Immigrants from Western Europe by Wage/Income Gap
In terms of wage/income gap, the demographic groups most similar to Immigrants from Western Europe are Ute (27.8%, a difference of 0.080%), Potawatomi (27.7%, a difference of 0.12%), New Zealander (27.7%, a difference of 0.13%), Immigrants from Korea (27.8%, a difference of 0.15%), and Turkish (27.7%, a difference of 0.21%).
| Demographics | Rating | Rank | Wage/Income Gap |
| Syrians | 1.4 /100 | #263 | Tragic 27.6% |
| Immigrants | Switzerland | 1.0 /100 | #264 | Tragic 27.7% |
| Serbians | 1.0 /100 | #265 | Tragic 27.7% |
| Hmong | 1.0 /100 | #266 | Tragic 27.7% |
| Turks | 1.0 /100 | #267 | Tragic 27.7% |
| New Zealanders | 1.0 /100 | #268 | Tragic 27.7% |
| Potawatomi | 0.9 /100 | #269 | Tragic 27.7% |
| Immigrants | Western Europe | 0.9 /100 | #270 | Tragic 27.8% |
| Ute | 0.8 /100 | #271 | Tragic 27.8% |
| Immigrants | Korea | 0.8 /100 | #272 | Tragic 27.8% |
| Bulgarians | 0.7 /100 | #273 | Tragic 27.8% |
| Americans | 0.7 /100 | #274 | Tragic 27.8% |
| Immigrants | Japan | 0.7 /100 | #275 | Tragic 27.9% |
| Lebanese | 0.7 /100 | #276 | Tragic 27.9% |
| Latvians | 0.7 /100 | #277 | Tragic 27.9% |
Demographics Similar to Alsatians by Wage/Income Gap
In terms of wage/income gap, the demographic groups most similar to Alsatians are Yup'ik (24.7%, a difference of 0.020%), Immigrants from Philippines (24.7%, a difference of 0.070%), Immigrants from Central America (24.6%, a difference of 0.080%), German Russian (24.6%, a difference of 0.14%), and Immigrants from Uruguay (24.6%, a difference of 0.15%).
| Demographics | Rating | Rank | Wage/Income Gap |
| Natives/Alaskans | 94.6 /100 | #123 | Exceptional 24.6% |
| Immigrants | South America | 93.9 /100 | #124 | Exceptional 24.6% |
| Spanish Americans | 93.8 /100 | #125 | Exceptional 24.6% |
| Immigrants | Uruguay | 93.8 /100 | #126 | Exceptional 24.6% |
| German Russians | 93.7 /100 | #127 | Exceptional 24.6% |
| Immigrants | Central America | 93.5 /100 | #128 | Exceptional 24.6% |
| Yup'ik | 93.3 /100 | #129 | Exceptional 24.7% |
| Alsatians | 93.2 /100 | #130 | Exceptional 24.7% |
| Immigrants | Philippines | 93.0 /100 | #131 | Exceptional 24.7% |
| Immigrants | Costa Rica | 92.4 /100 | #132 | Exceptional 24.7% |
| Colombians | 92.4 /100 | #133 | Exceptional 24.7% |
| Mexican American Indians | 92.2 /100 | #134 | Exceptional 24.7% |
| South American Indians | 92.0 /100 | #135 | Exceptional 24.7% |
| Armenians | 91.3 /100 | #136 | Exceptional 24.8% |
| Immigrants | South Eastern Asia | 90.9 /100 | #137 | Exceptional 24.8% |