Immigrants from Western Europe vs Haitian Wage/Income Gap
COMPARE
Immigrants from Western Europe
Haitian
Wage/Income Gap
Wage/Income Gap Comparison
Immigrants from Western Europe
Haitians
27.8%
WAGE/INCOME GAP
0.9/ 100
METRIC RATING
270th/ 347
METRIC RANK
19.7%
WAGE/INCOME GAP
100.0/ 100
METRIC RATING
17th/ 347
METRIC RANK
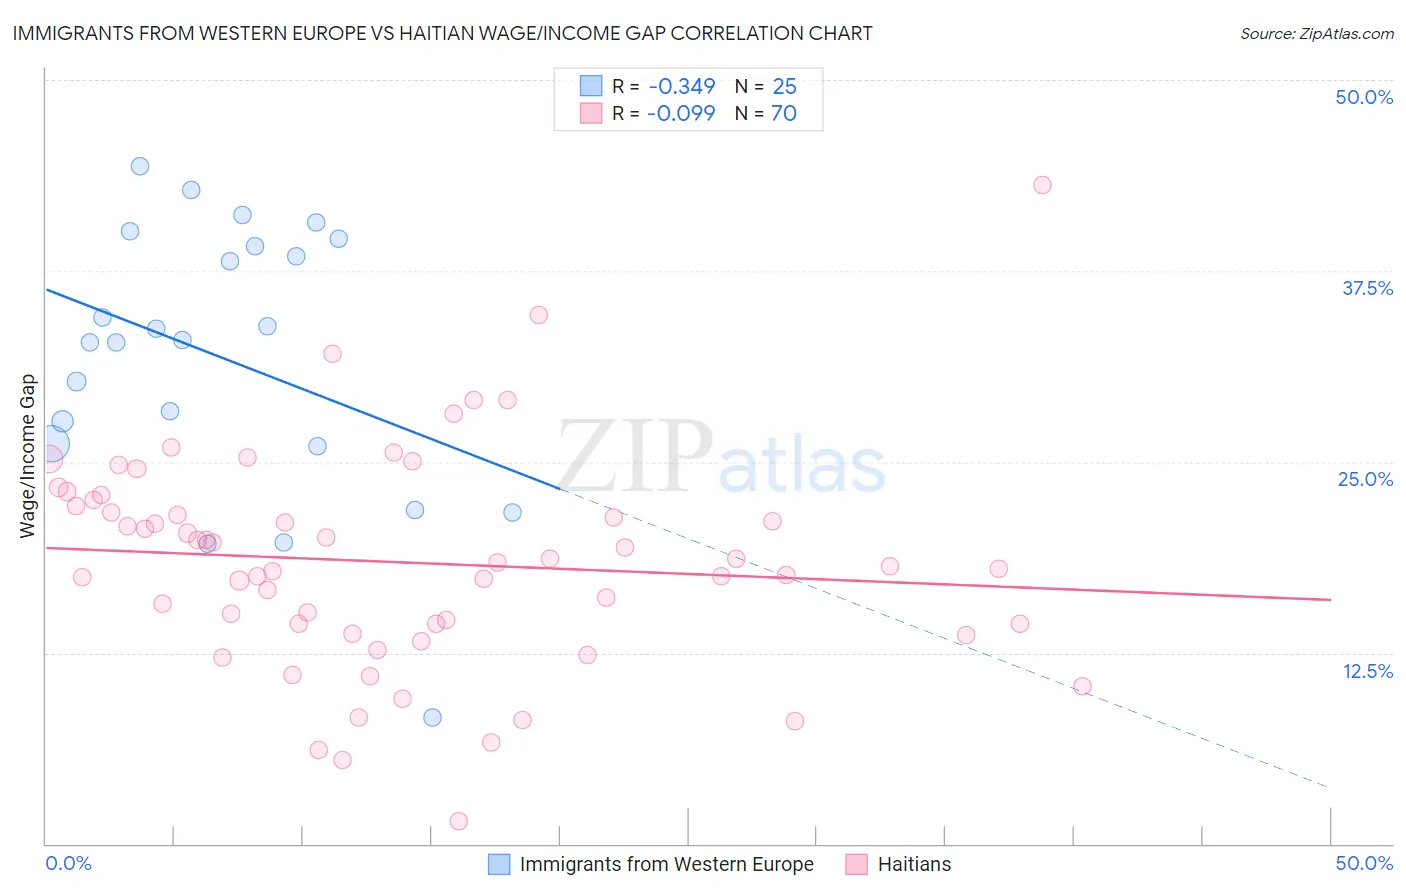
Immigrants from Western Europe vs Haitian Wage/Income Gap Correlation Chart
The statistical analysis conducted on geographies consisting of 493,207,642 people shows a mild negative correlation between the proportion of Immigrants from Western Europe and wage/income gap percentage in the United States with a correlation coefficient (R) of -0.349 and weighted average of 27.8%. Similarly, the statistical analysis conducted on geographies consisting of 287,832,408 people shows a slight negative correlation between the proportion of Haitians and wage/income gap percentage in the United States with a correlation coefficient (R) of -0.099 and weighted average of 19.7%, a difference of 40.6%.
Wage/Income Gap Correlation Summary
| Measurement | Immigrants from Western Europe | Haitian |
| Minimum | 8.2% | 1.5% |
| Maximum | 44.3% | 43.2% |
| Range | 36.1% | 41.7% |
| Mean | 31.8% | 18.4% |
| Median | 33.0% | 18.3% |
| Interquartile 25% (IQ1) | 26.1% | 14.4% |
| Interquartile 75% (IQ3) | 39.4% | 22.1% |
| Interquartile Range (IQR) | 13.2% | 7.7% |
| Standard Deviation (Sample) | 8.8% | 7.1% |
| Standard Deviation (Population) | 8.7% | 7.0% |
Similar Demographics by Wage/Income Gap
Demographics Similar to Immigrants from Western Europe by Wage/Income Gap
In terms of wage/income gap, the demographic groups most similar to Immigrants from Western Europe are Ute (27.8%, a difference of 0.080%), Potawatomi (27.7%, a difference of 0.12%), New Zealander (27.7%, a difference of 0.13%), Immigrants from Korea (27.8%, a difference of 0.15%), and Turkish (27.7%, a difference of 0.21%).
| Demographics | Rating | Rank | Wage/Income Gap |
| Syrians | 1.4 /100 | #263 | Tragic 27.6% |
| Immigrants | Switzerland | 1.0 /100 | #264 | Tragic 27.7% |
| Serbians | 1.0 /100 | #265 | Tragic 27.7% |
| Hmong | 1.0 /100 | #266 | Tragic 27.7% |
| Turks | 1.0 /100 | #267 | Tragic 27.7% |
| New Zealanders | 1.0 /100 | #268 | Tragic 27.7% |
| Potawatomi | 0.9 /100 | #269 | Tragic 27.7% |
| Immigrants | Western Europe | 0.9 /100 | #270 | Tragic 27.8% |
| Ute | 0.8 /100 | #271 | Tragic 27.8% |
| Immigrants | Korea | 0.8 /100 | #272 | Tragic 27.8% |
| Bulgarians | 0.7 /100 | #273 | Tragic 27.8% |
| Americans | 0.7 /100 | #274 | Tragic 27.8% |
| Immigrants | Japan | 0.7 /100 | #275 | Tragic 27.9% |
| Lebanese | 0.7 /100 | #276 | Tragic 27.9% |
| Latvians | 0.7 /100 | #277 | Tragic 27.9% |
Demographics Similar to Haitians by Wage/Income Gap
In terms of wage/income gap, the demographic groups most similar to Haitians are Jamaican (19.6%, a difference of 0.78%), West Indian (19.6%, a difference of 0.91%), Hopi (20.0%, a difference of 1.4%), Immigrants from Dominica (20.0%, a difference of 1.4%), and Immigrants from Trinidad and Tobago (19.3%, a difference of 2.1%).
| Demographics | Rating | Rank | Wage/Income Gap |
| Crow | 100.0 /100 | #10 | Exceptional 19.1% |
| Immigrants | Haiti | 100.0 /100 | #11 | Exceptional 19.2% |
| Immigrants | West Indies | 100.0 /100 | #12 | Exceptional 19.2% |
| Trinidadians and Tobagonians | 100.0 /100 | #13 | Exceptional 19.3% |
| Immigrants | Trinidad and Tobago | 100.0 /100 | #14 | Exceptional 19.3% |
| West Indians | 100.0 /100 | #15 | Exceptional 19.6% |
| Jamaicans | 100.0 /100 | #16 | Exceptional 19.6% |
| Haitians | 100.0 /100 | #17 | Exceptional 19.7% |
| Hopi | 100.0 /100 | #18 | Exceptional 20.0% |
| Immigrants | Dominica | 100.0 /100 | #19 | Exceptional 20.0% |
| Bahamians | 100.0 /100 | #20 | Exceptional 20.2% |
| Immigrants | Caribbean | 100.0 /100 | #21 | Exceptional 20.4% |
| Immigrants | Liberia | 100.0 /100 | #22 | Exceptional 20.6% |
| Immigrants | Dominican Republic | 100.0 /100 | #23 | Exceptional 20.6% |
| Dominicans | 100.0 /100 | #24 | Exceptional 20.6% |