Iroquois vs Salvadoran Median Earnings
COMPARE
Iroquois
Salvadoran
Median Earnings
Median Earnings Comparison
Iroquois
Salvadorans
$42,430
MEDIAN EARNINGS
0.4/ 100
METRIC RATING
272nd/ 347
METRIC RANK
$42,912
MEDIAN EARNINGS
0.7/ 100
METRIC RATING
265th/ 347
METRIC RANK
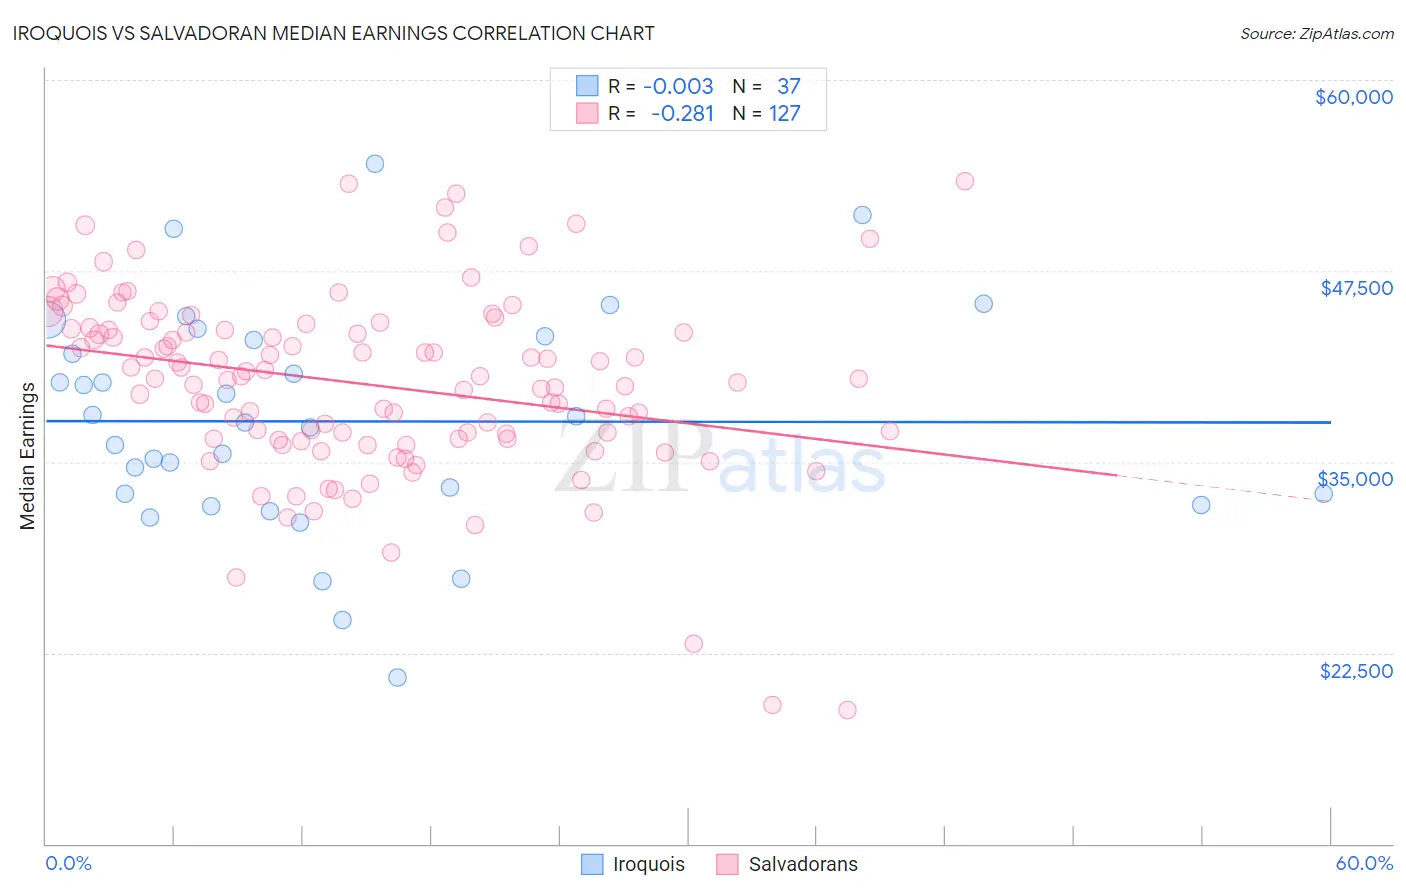
Iroquois vs Salvadoran Median Earnings Correlation Chart
The statistical analysis conducted on geographies consisting of 207,284,609 people shows no correlation between the proportion of Iroquois and median earnings in the United States with a correlation coefficient (R) of -0.003 and weighted average of $42,430. Similarly, the statistical analysis conducted on geographies consisting of 398,992,424 people shows a weak negative correlation between the proportion of Salvadorans and median earnings in the United States with a correlation coefficient (R) of -0.281 and weighted average of $42,912, a difference of 1.1%.
Median Earnings Correlation Summary
| Measurement | Iroquois | Salvadoran |
| Minimum | $20,893 | $18,725 |
| Maximum | $54,543 | $53,384 |
| Range | $33,650 | $34,659 |
| Mean | $37,652 | $40,078 |
| Median | $37,608 | $40,477 |
| Interquartile 25% (IQ1) | $32,548 | $36,514 |
| Interquartile 75% (IQ3) | $43,095 | $43,731 |
| Interquartile Range (IQR) | $10,547 | $7,217 |
| Standard Deviation (Sample) | $7,302 | $6,041 |
| Standard Deviation (Population) | $7,203 | $6,017 |
Demographics Similar to Iroquois and Salvadorans by Median Earnings
In terms of median earnings, the demographic groups most similar to Iroquois are Immigrants from Dominica ($42,420, a difference of 0.030%), Immigrants from El Salvador ($42,413, a difference of 0.040%), Immigrants from Belize ($42,339, a difference of 0.22%), Spanish American ($42,316, a difference of 0.27%), and Central American ($42,280, a difference of 0.36%). Similarly, the demographic groups most similar to Salvadorans are Immigrants from Liberia ($42,923, a difference of 0.030%), Immigrants from Laos ($42,884, a difference of 0.060%), Inupiat ($43,000, a difference of 0.20%), Immigrants from Jamaica ($43,026, a difference of 0.27%), and Nicaraguan ($43,026, a difference of 0.27%).
| Demographics | Rating | Rank | Median Earnings |
| French American Indians | 1.3 /100 | #258 | Tragic $43,333 |
| German Russians | 1.1 /100 | #259 | Tragic $43,200 |
| Immigrants | Somalia | 0.9 /100 | #260 | Tragic $43,100 |
| Immigrants | Jamaica | 0.8 /100 | #261 | Tragic $43,026 |
| Nicaraguans | 0.8 /100 | #262 | Tragic $43,026 |
| Inupiat | 0.8 /100 | #263 | Tragic $43,000 |
| Immigrants | Liberia | 0.7 /100 | #264 | Tragic $42,923 |
| Salvadorans | 0.7 /100 | #265 | Tragic $42,912 |
| Immigrants | Laos | 0.7 /100 | #266 | Tragic $42,884 |
| Cree | 0.6 /100 | #267 | Tragic $42,777 |
| Americans | 0.6 /100 | #268 | Tragic $42,742 |
| Belizeans | 0.5 /100 | #269 | Tragic $42,702 |
| Osage | 0.5 /100 | #270 | Tragic $42,651 |
| Pennsylvania Germans | 0.5 /100 | #271 | Tragic $42,615 |
| Iroquois | 0.4 /100 | #272 | Tragic $42,430 |
| Immigrants | Dominica | 0.4 /100 | #273 | Tragic $42,420 |
| Immigrants | El Salvador | 0.4 /100 | #274 | Tragic $42,413 |
| Immigrants | Belize | 0.3 /100 | #275 | Tragic $42,339 |
| Spanish Americans | 0.3 /100 | #276 | Tragic $42,316 |
| Central Americans | 0.3 /100 | #277 | Tragic $42,280 |
| Cajuns | 0.3 /100 | #278 | Tragic $42,189 |