Immigrants from Portugal vs Salvadoran Median Earnings
COMPARE
Immigrants from Portugal
Salvadoran
Median Earnings
Median Earnings Comparison
Immigrants from Portugal
Salvadorans
$47,304
MEDIAN EARNINGS
77.3/ 100
METRIC RATING
154th/ 347
METRIC RANK
$42,912
MEDIAN EARNINGS
0.7/ 100
METRIC RATING
265th/ 347
METRIC RANK
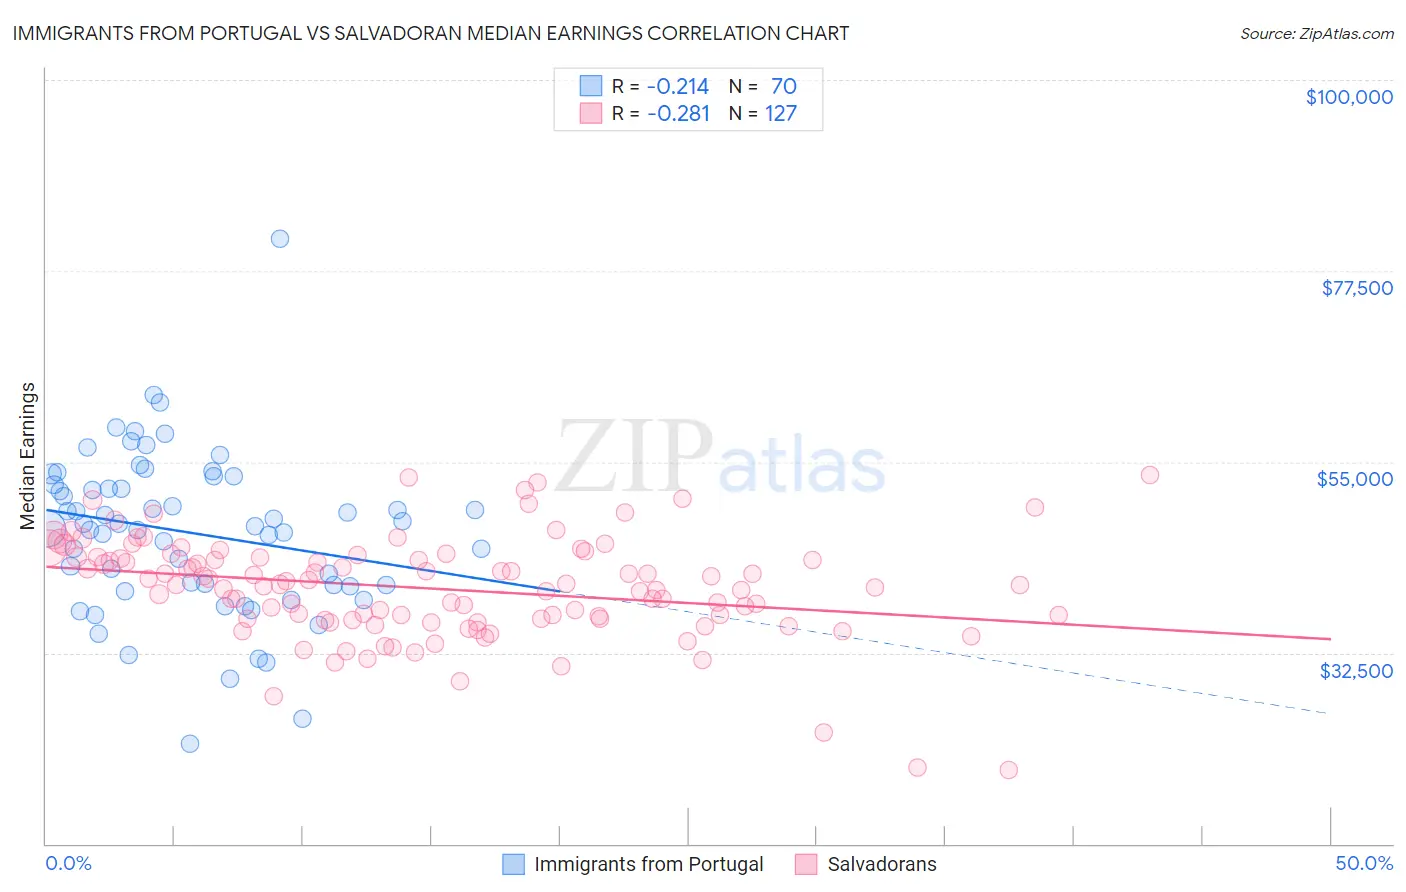
Immigrants from Portugal vs Salvadoran Median Earnings Correlation Chart
The statistical analysis conducted on geographies consisting of 174,787,782 people shows a weak negative correlation between the proportion of Immigrants from Portugal and median earnings in the United States with a correlation coefficient (R) of -0.214 and weighted average of $47,304. Similarly, the statistical analysis conducted on geographies consisting of 398,992,424 people shows a weak negative correlation between the proportion of Salvadorans and median earnings in the United States with a correlation coefficient (R) of -0.281 and weighted average of $42,912, a difference of 10.2%.
Median Earnings Correlation Summary
| Measurement | Immigrants from Portugal | Salvadoran |
| Minimum | $21,818 | $18,725 |
| Maximum | $81,250 | $53,384 |
| Range | $59,432 | $34,659 |
| Mean | $46,644 | $40,078 |
| Median | $47,553 | $40,477 |
| Interquartile 25% (IQ1) | $40,436 | $36,514 |
| Interquartile 75% (IQ3) | $52,307 | $43,731 |
| Interquartile Range (IQR) | $11,871 | $7,217 |
| Standard Deviation (Sample) | $9,540 | $6,041 |
| Standard Deviation (Population) | $9,471 | $6,017 |
Similar Demographics by Median Earnings
Demographics Similar to Immigrants from Portugal by Median Earnings
In terms of median earnings, the demographic groups most similar to Immigrants from Portugal are Immigrants from Vietnam ($47,282, a difference of 0.050%), Irish ($47,276, a difference of 0.060%), Czech ($47,221, a difference of 0.18%), Slavic ($47,470, a difference of 0.35%), and Slovak ($47,095, a difference of 0.44%).
| Demographics | Rating | Rank | Median Earnings |
| Immigrants | South Eastern Asia | 85.0 /100 | #147 | Excellent $47,671 |
| Immigrants | Eritrea | 84.8 /100 | #148 | Excellent $47,657 |
| Luxembourgers | 84.5 /100 | #149 | Excellent $47,640 |
| Peruvians | 84.2 /100 | #150 | Excellent $47,628 |
| Immigrants | Oceania | 84.1 /100 | #151 | Excellent $47,617 |
| Immigrants | Germany | 83.1 /100 | #152 | Excellent $47,566 |
| Slavs | 81.1 /100 | #153 | Excellent $47,470 |
| Immigrants | Portugal | 77.3 /100 | #154 | Good $47,304 |
| Immigrants | Vietnam | 76.7 /100 | #155 | Good $47,282 |
| Irish | 76.6 /100 | #156 | Good $47,276 |
| Czechs | 75.1 /100 | #157 | Good $47,221 |
| Slovaks | 71.7 /100 | #158 | Good $47,095 |
| Immigrants | Peru | 69.6 /100 | #159 | Good $47,025 |
| Alsatians | 69.6 /100 | #160 | Good $47,023 |
| Immigrants | Eastern Africa | 68.0 /100 | #161 | Good $46,969 |
Demographics Similar to Salvadorans by Median Earnings
In terms of median earnings, the demographic groups most similar to Salvadorans are Immigrants from Liberia ($42,923, a difference of 0.030%), Immigrants from Laos ($42,884, a difference of 0.060%), Inupiat ($43,000, a difference of 0.20%), Immigrants from Jamaica ($43,026, a difference of 0.27%), and Nicaraguan ($43,026, a difference of 0.27%).
| Demographics | Rating | Rank | Median Earnings |
| French American Indians | 1.3 /100 | #258 | Tragic $43,333 |
| German Russians | 1.1 /100 | #259 | Tragic $43,200 |
| Immigrants | Somalia | 0.9 /100 | #260 | Tragic $43,100 |
| Immigrants | Jamaica | 0.8 /100 | #261 | Tragic $43,026 |
| Nicaraguans | 0.8 /100 | #262 | Tragic $43,026 |
| Inupiat | 0.8 /100 | #263 | Tragic $43,000 |
| Immigrants | Liberia | 0.7 /100 | #264 | Tragic $42,923 |
| Salvadorans | 0.7 /100 | #265 | Tragic $42,912 |
| Immigrants | Laos | 0.7 /100 | #266 | Tragic $42,884 |
| Cree | 0.6 /100 | #267 | Tragic $42,777 |
| Americans | 0.6 /100 | #268 | Tragic $42,742 |
| Belizeans | 0.5 /100 | #269 | Tragic $42,702 |
| Osage | 0.5 /100 | #270 | Tragic $42,651 |
| Pennsylvania Germans | 0.5 /100 | #271 | Tragic $42,615 |
| Iroquois | 0.4 /100 | #272 | Tragic $42,430 |