Immigrants from Romania vs Salvadoran Median Earnings
COMPARE
Immigrants from Romania
Salvadoran
Median Earnings
Median Earnings Comparison
Immigrants from Romania
Salvadorans
$51,337
MEDIAN EARNINGS
99.9/ 100
METRIC RATING
62nd/ 347
METRIC RANK
$42,912
MEDIAN EARNINGS
0.7/ 100
METRIC RATING
265th/ 347
METRIC RANK
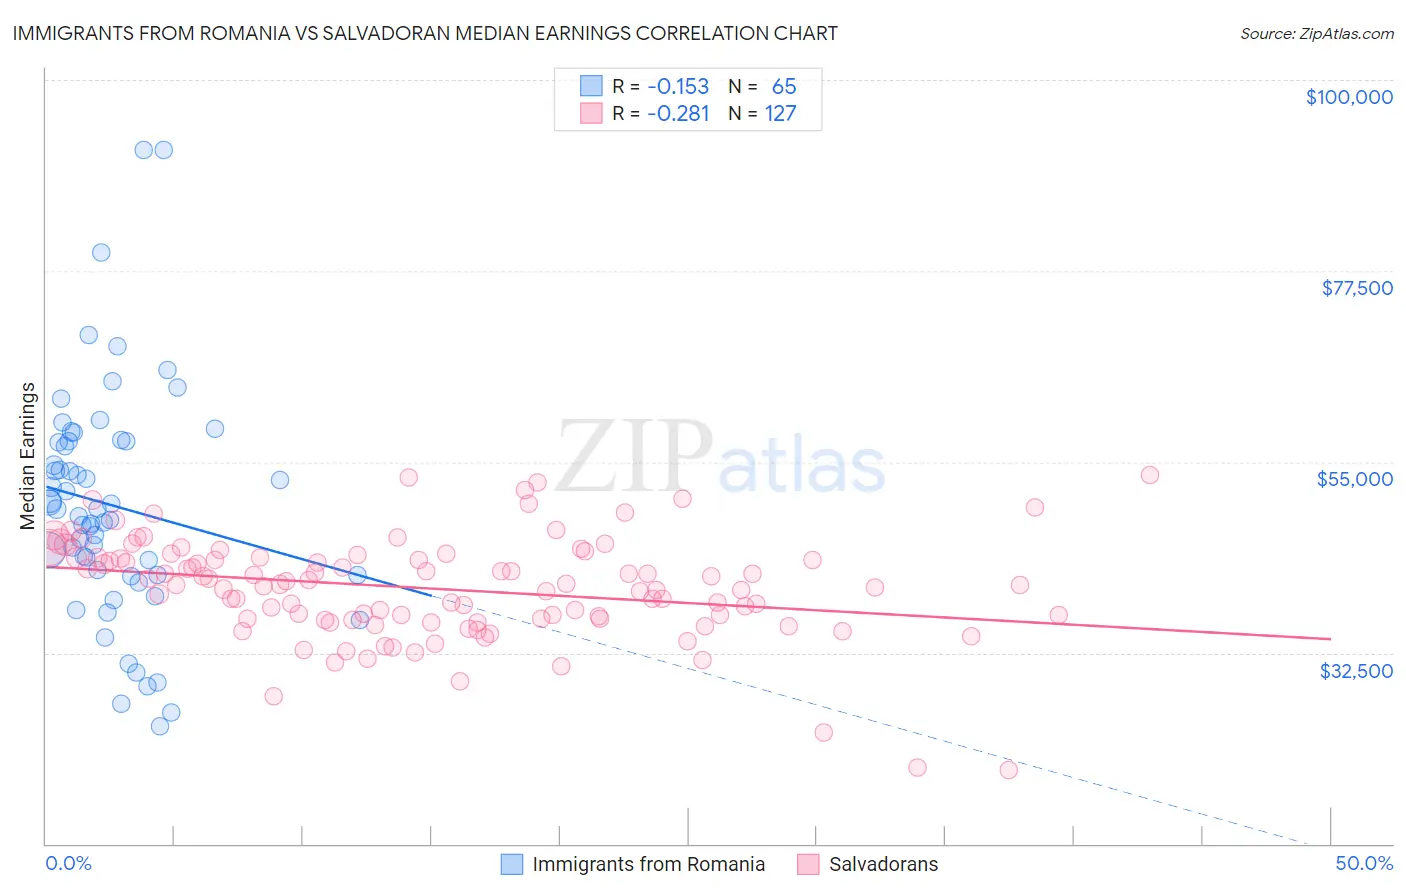
Immigrants from Romania vs Salvadoran Median Earnings Correlation Chart
The statistical analysis conducted on geographies consisting of 257,003,110 people shows a poor negative correlation between the proportion of Immigrants from Romania and median earnings in the United States with a correlation coefficient (R) of -0.153 and weighted average of $51,337. Similarly, the statistical analysis conducted on geographies consisting of 398,992,424 people shows a weak negative correlation between the proportion of Salvadorans and median earnings in the United States with a correlation coefficient (R) of -0.281 and weighted average of $42,912, a difference of 19.6%.
Median Earnings Correlation Summary
| Measurement | Immigrants from Romania | Salvadoran |
| Minimum | $23,864 | $18,725 |
| Maximum | $91,786 | $53,384 |
| Range | $67,922 | $34,659 |
| Mean | $49,856 | $40,078 |
| Median | $49,415 | $40,477 |
| Interquartile 25% (IQ1) | $41,640 | $36,514 |
| Interquartile 75% (IQ3) | $57,433 | $43,731 |
| Interquartile Range (IQR) | $15,793 | $7,217 |
| Standard Deviation (Sample) | $13,572 | $6,041 |
| Standard Deviation (Population) | $13,467 | $6,017 |
Similar Demographics by Median Earnings
Demographics Similar to Immigrants from Romania by Median Earnings
In terms of median earnings, the demographic groups most similar to Immigrants from Romania are Immigrants from Bulgaria ($51,318, a difference of 0.040%), New Zealander ($51,246, a difference of 0.18%), Greek ($51,164, a difference of 0.34%), Immigrants from Latvia ($51,555, a difference of 0.42%), and Immigrants from Serbia ($51,557, a difference of 0.43%).
| Demographics | Rating | Rank | Median Earnings |
| Egyptians | 99.9 /100 | #55 | Exceptional $51,701 |
| Immigrants | Pakistan | 99.9 /100 | #56 | Exceptional $51,693 |
| Immigrants | Eastern Europe | 99.9 /100 | #57 | Exceptional $51,624 |
| Immigrants | Bolivia | 99.9 /100 | #58 | Exceptional $51,605 |
| Immigrants | Croatia | 99.9 /100 | #59 | Exceptional $51,581 |
| Immigrants | Serbia | 99.9 /100 | #60 | Exceptional $51,557 |
| Immigrants | Latvia | 99.9 /100 | #61 | Exceptional $51,555 |
| Immigrants | Romania | 99.9 /100 | #62 | Exceptional $51,337 |
| Immigrants | Bulgaria | 99.9 /100 | #63 | Exceptional $51,318 |
| New Zealanders | 99.9 /100 | #64 | Exceptional $51,246 |
| Greeks | 99.9 /100 | #65 | Exceptional $51,164 |
| Afghans | 99.9 /100 | #66 | Exceptional $51,112 |
| Immigrants | Spain | 99.9 /100 | #67 | Exceptional $51,092 |
| Paraguayans | 99.9 /100 | #68 | Exceptional $51,068 |
| Mongolians | 99.8 /100 | #69 | Exceptional $51,038 |
Demographics Similar to Salvadorans by Median Earnings
In terms of median earnings, the demographic groups most similar to Salvadorans are Immigrants from Liberia ($42,923, a difference of 0.030%), Immigrants from Laos ($42,884, a difference of 0.060%), Inupiat ($43,000, a difference of 0.20%), Immigrants from Jamaica ($43,026, a difference of 0.27%), and Nicaraguan ($43,026, a difference of 0.27%).
| Demographics | Rating | Rank | Median Earnings |
| French American Indians | 1.3 /100 | #258 | Tragic $43,333 |
| German Russians | 1.1 /100 | #259 | Tragic $43,200 |
| Immigrants | Somalia | 0.9 /100 | #260 | Tragic $43,100 |
| Immigrants | Jamaica | 0.8 /100 | #261 | Tragic $43,026 |
| Nicaraguans | 0.8 /100 | #262 | Tragic $43,026 |
| Inupiat | 0.8 /100 | #263 | Tragic $43,000 |
| Immigrants | Liberia | 0.7 /100 | #264 | Tragic $42,923 |
| Salvadorans | 0.7 /100 | #265 | Tragic $42,912 |
| Immigrants | Laos | 0.7 /100 | #266 | Tragic $42,884 |
| Cree | 0.6 /100 | #267 | Tragic $42,777 |
| Americans | 0.6 /100 | #268 | Tragic $42,742 |
| Belizeans | 0.5 /100 | #269 | Tragic $42,702 |
| Osage | 0.5 /100 | #270 | Tragic $42,651 |
| Pennsylvania Germans | 0.5 /100 | #271 | Tragic $42,615 |
| Iroquois | 0.4 /100 | #272 | Tragic $42,430 |