Immigrants from Trinidad and Tobago vs Immigrants from West Indies In Labor Force | Age 16-19
COMPARE
Immigrants from Trinidad and Tobago
Immigrants from West Indies
In Labor Force | Age 16-19
In Labor Force | Age 16-19 Comparison
Immigrants from Trinidad and Tobago
Immigrants from West Indies
30.2%
IN LABOR FORCE | AGE 16-19
0.0/ 100
METRIC RATING
336th/ 347
METRIC RANK
31.7%
IN LABOR FORCE | AGE 16-19
0.0/ 100
METRIC RATING
315th/ 347
METRIC RANK
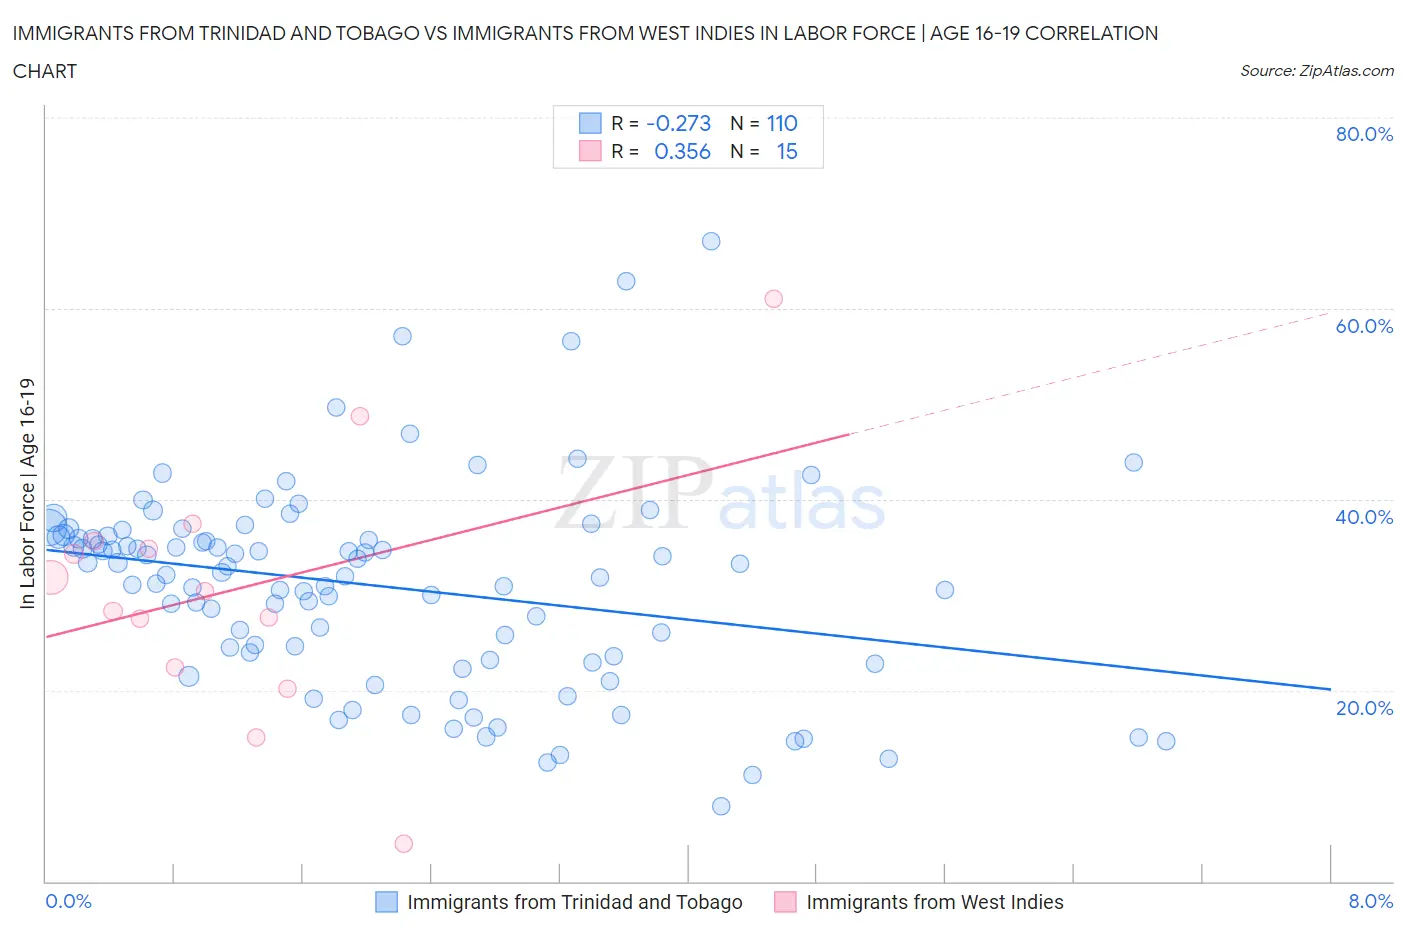
Immigrants from Trinidad and Tobago vs Immigrants from West Indies In Labor Force | Age 16-19 Correlation Chart
The statistical analysis conducted on geographies consisting of 223,335,847 people shows a weak negative correlation between the proportion of Immigrants from Trinidad and Tobago and labor force participation rate among population between the ages 16 and 19 in the United States with a correlation coefficient (R) of -0.273 and weighted average of 30.2%. Similarly, the statistical analysis conducted on geographies consisting of 72,428,382 people shows a mild positive correlation between the proportion of Immigrants from West Indies and labor force participation rate among population between the ages 16 and 19 in the United States with a correlation coefficient (R) of 0.356 and weighted average of 31.7%, a difference of 5.1%.
In Labor Force | Age 16-19 Correlation Summary
| Measurement | Immigrants from Trinidad and Tobago | Immigrants from West Indies |
| Minimum | 7.9% | 3.9% |
| Maximum | 67.1% | 61.0% |
| Range | 59.2% | 57.1% |
| Mean | 30.9% | 30.6% |
| Median | 32.2% | 30.4% |
| Interquartile 25% (IQ1) | 23.6% | 22.4% |
| Interquartile 75% (IQ3) | 36.1% | 35.6% |
| Interquartile Range (IQR) | 12.5% | 13.3% |
| Standard Deviation (Sample) | 10.6% | 13.4% |
| Standard Deviation (Population) | 10.5% | 12.9% |
Similar Demographics by In Labor Force | Age 16-19
Demographics Similar to Immigrants from Trinidad and Tobago by In Labor Force | Age 16-19
In terms of in labor force | age 16-19, the demographic groups most similar to Immigrants from Trinidad and Tobago are Immigrants from Cuba (30.2%, a difference of 0.29%), Immigrants from Bangladesh (30.0%, a difference of 0.37%), Puerto Rican (30.3%, a difference of 0.62%), Immigrants from Hong Kong (30.5%, a difference of 1.0%), and Immigrants from Israel (30.5%, a difference of 1.1%).
| Demographics | Rating | Rank | In Labor Force | Age 16-19 |
| Barbadians | 0.0 /100 | #329 | Tragic 31.0% |
| Lumbee | 0.0 /100 | #330 | Tragic 31.0% |
| Trinidadians and Tobagonians | 0.0 /100 | #331 | Tragic 30.9% |
| Immigrants | Israel | 0.0 /100 | #332 | Tragic 30.5% |
| Immigrants | Hong Kong | 0.0 /100 | #333 | Tragic 30.5% |
| Puerto Ricans | 0.0 /100 | #334 | Tragic 30.3% |
| Immigrants | Cuba | 0.0 /100 | #335 | Tragic 30.2% |
| Immigrants | Trinidad and Tobago | 0.0 /100 | #336 | Tragic 30.2% |
| Immigrants | Bangladesh | 0.0 /100 | #337 | Tragic 30.0% |
| Vietnamese | 0.0 /100 | #338 | Tragic 29.6% |
| Immigrants | Uzbekistan | 0.0 /100 | #339 | Tragic 29.2% |
| British West Indians | 0.0 /100 | #340 | Tragic 29.1% |
| Immigrants | Armenia | 0.0 /100 | #341 | Tragic 29.0% |
| Immigrants | Barbados | 0.0 /100 | #342 | Tragic 29.0% |
| Yuman | 0.0 /100 | #343 | Tragic 27.7% |
Demographics Similar to Immigrants from West Indies by In Labor Force | Age 16-19
In terms of in labor force | age 16-19, the demographic groups most similar to Immigrants from West Indies are Filipino (31.7%, a difference of 0.080%), Cuban (31.8%, a difference of 0.18%), Immigrants from Nicaragua (31.6%, a difference of 0.28%), Immigrants from Belize (31.8%, a difference of 0.34%), and Hopi (31.8%, a difference of 0.34%).
| Demographics | Rating | Rank | In Labor Force | Age 16-19 |
| Navajo | 0.0 /100 | #308 | Tragic 32.1% |
| Immigrants | Eastern Asia | 0.0 /100 | #309 | Tragic 32.0% |
| Immigrants | Iran | 0.0 /100 | #310 | Tragic 32.0% |
| Indians (Asian) | 0.0 /100 | #311 | Tragic 31.9% |
| Immigrants | Belize | 0.0 /100 | #312 | Tragic 31.8% |
| Hopi | 0.0 /100 | #313 | Tragic 31.8% |
| Cubans | 0.0 /100 | #314 | Tragic 31.8% |
| Immigrants | West Indies | 0.0 /100 | #315 | Tragic 31.7% |
| Filipinos | 0.0 /100 | #316 | Tragic 31.7% |
| Immigrants | Nicaragua | 0.0 /100 | #317 | Tragic 31.6% |
| Immigrants | Yemen | 0.0 /100 | #318 | Tragic 31.5% |
| Soviet Union | 0.0 /100 | #319 | Tragic 31.4% |
| Ecuadorians | 0.0 /100 | #320 | Tragic 31.4% |
| West Indians | 0.0 /100 | #321 | Tragic 31.3% |
| Tohono O'odham | 0.0 /100 | #322 | Tragic 31.3% |