Immigrants from Syria vs Immigrants from Norway Wage/Income Gap
COMPARE
Immigrants from Syria
Immigrants from Norway
Wage/Income Gap
Wage/Income Gap Comparison
Immigrants from Syria
Immigrants from Norway
26.4%
WAGE/INCOME GAP
19.3/ 100
METRIC RATING
201st/ 347
METRIC RANK
27.3%
WAGE/INCOME GAP
2.5/ 100
METRIC RATING
251st/ 347
METRIC RANK
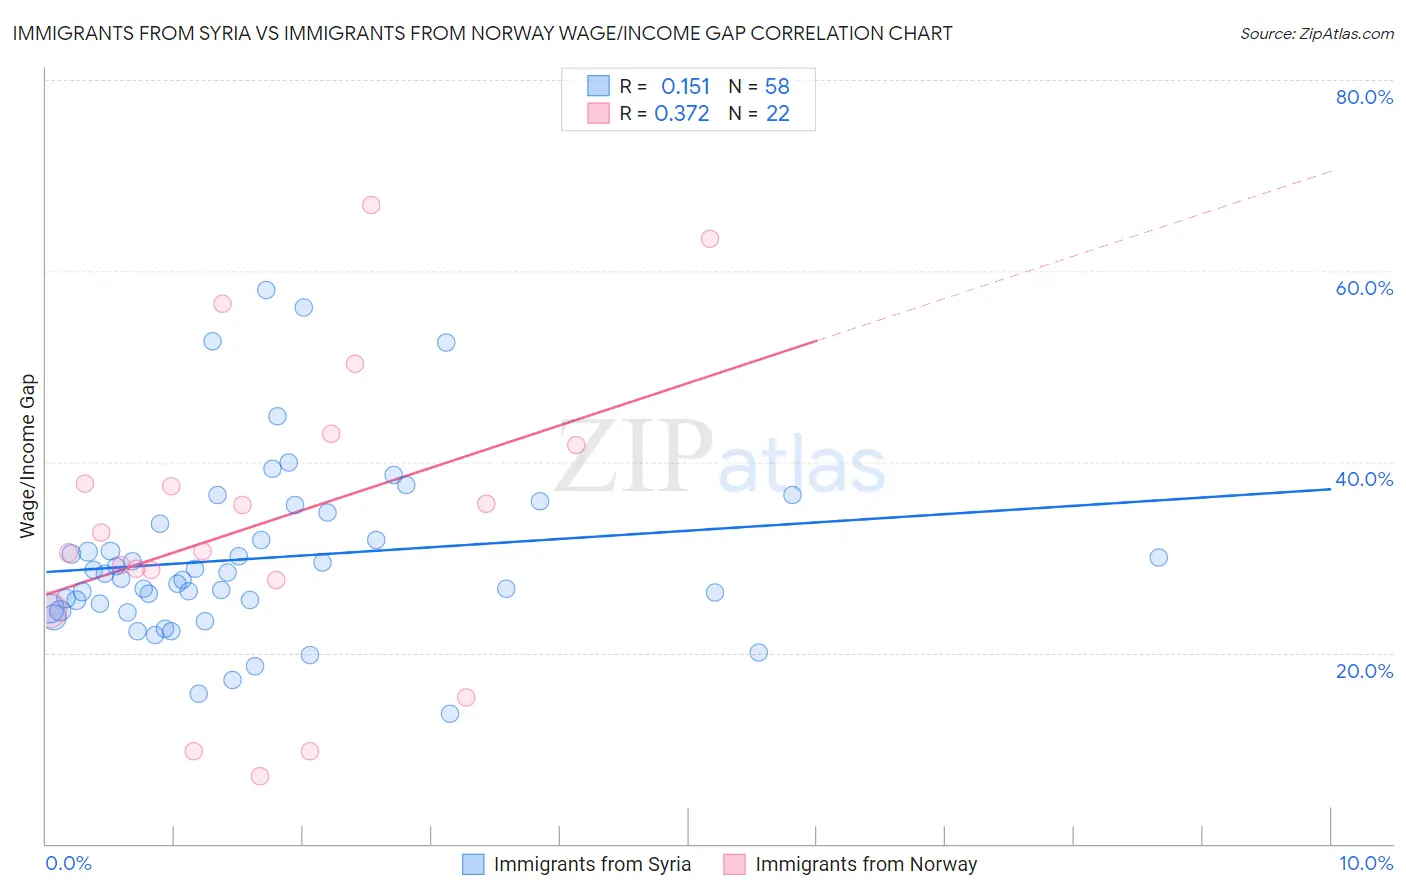
Immigrants from Syria vs Immigrants from Norway Wage/Income Gap Correlation Chart
The statistical analysis conducted on geographies consisting of 174,099,463 people shows a poor positive correlation between the proportion of Immigrants from Syria and wage/income gap percentage in the United States with a correlation coefficient (R) of 0.151 and weighted average of 26.4%. Similarly, the statistical analysis conducted on geographies consisting of 116,688,062 people shows a mild positive correlation between the proportion of Immigrants from Norway and wage/income gap percentage in the United States with a correlation coefficient (R) of 0.372 and weighted average of 27.3%, a difference of 3.5%.
Wage/Income Gap Correlation Summary
| Measurement | Immigrants from Syria | Immigrants from Norway |
| Minimum | 13.6% | 7.1% |
| Maximum | 58.0% | 66.9% |
| Range | 44.4% | 59.8% |
| Mean | 29.9% | 33.7% |
| Median | 28.0% | 31.6% |
| Interquartile 25% (IQ1) | 24.7% | 27.6% |
| Interquartile 75% (IQ3) | 33.5% | 41.8% |
| Interquartile Range (IQR) | 8.8% | 14.2% |
| Standard Deviation (Sample) | 9.2% | 16.0% |
| Standard Deviation (Population) | 9.1% | 15.6% |
Similar Demographics by Wage/Income Gap
Demographics Similar to Immigrants from Syria by Wage/Income Gap
In terms of wage/income gap, the demographic groups most similar to Immigrants from Syria are Laotian (26.4%, a difference of 0.010%), Immigrants from Eastern Europe (26.4%, a difference of 0.010%), Immigrants from Russia (26.4%, a difference of 0.030%), Delaware (26.3%, a difference of 0.16%), and Dutch West Indian (26.3%, a difference of 0.17%).
| Demographics | Rating | Rank | Wage/Income Gap |
| Chileans | 22.3 /100 | #194 | Fair 26.3% |
| Immigrants | Malaysia | 22.2 /100 | #195 | Fair 26.3% |
| Immigrants | Western Asia | 21.7 /100 | #196 | Fair 26.3% |
| Zimbabweans | 21.6 /100 | #197 | Fair 26.3% |
| Venezuelans | 21.5 /100 | #198 | Fair 26.3% |
| Dutch West Indians | 21.0 /100 | #199 | Fair 26.3% |
| Delaware | 20.9 /100 | #200 | Fair 26.3% |
| Immigrants | Syria | 19.3 /100 | #201 | Poor 26.4% |
| Laotians | 19.2 /100 | #202 | Poor 26.4% |
| Immigrants | Eastern Europe | 19.2 /100 | #203 | Poor 26.4% |
| Immigrants | Russia | 19.0 /100 | #204 | Poor 26.4% |
| Immigrants | Southern Europe | 17.3 /100 | #205 | Poor 26.4% |
| Indians (Asian) | 16.5 /100 | #206 | Poor 26.4% |
| Immigrants | Italy | 15.8 /100 | #207 | Poor 26.5% |
| Egyptians | 12.7 /100 | #208 | Poor 26.6% |
Demographics Similar to Immigrants from Norway by Wage/Income Gap
In terms of wage/income gap, the demographic groups most similar to Immigrants from Norway are Ukrainian (27.3%, a difference of 0.060%), Immigrants from Czechoslovakia (27.3%, a difference of 0.10%), Carpatho Rusyn (27.3%, a difference of 0.12%), Cypriot (27.3%, a difference of 0.13%), and Celtic (27.3%, a difference of 0.14%).
| Demographics | Rating | Rank | Wage/Income Gap |
| Chickasaw | 3.5 /100 | #244 | Tragic 27.2% |
| Immigrants | Azores | 3.5 /100 | #245 | Tragic 27.2% |
| Immigrants | Nonimmigrants | 3.3 /100 | #246 | Tragic 27.2% |
| Celtics | 2.8 /100 | #247 | Tragic 27.3% |
| Cypriots | 2.8 /100 | #248 | Tragic 27.3% |
| Carpatho Rusyns | 2.7 /100 | #249 | Tragic 27.3% |
| Immigrants | Czechoslovakia | 2.7 /100 | #250 | Tragic 27.3% |
| Immigrants | Norway | 2.5 /100 | #251 | Tragic 27.3% |
| Ukrainians | 2.4 /100 | #252 | Tragic 27.3% |
| Portuguese | 2.2 /100 | #253 | Tragic 27.4% |
| Israelis | 2.1 /100 | #254 | Tragic 27.4% |
| Immigrants | France | 2.1 /100 | #255 | Tragic 27.4% |
| Cherokee | 1.9 /100 | #256 | Tragic 27.4% |
| Luxembourgers | 1.9 /100 | #257 | Tragic 27.4% |
| Slavs | 1.8 /100 | #258 | Tragic 27.4% |