Immigrants from Switzerland vs Immigrants from Japan Householder Income Ages 25 - 44 years
COMPARE
Immigrants from Switzerland
Immigrants from Japan
Householder Income Ages 25 - 44 years
Householder Income Ages 25 - 44 years Comparison
Immigrants from Switzerland
Immigrants from Japan
$109,185
HOUSEHOLDER INCOME AGES 25 - 44 YEARS
100.0/ 100
METRIC RATING
35th/ 347
METRIC RANK
$112,228
HOUSEHOLDER INCOME AGES 25 - 44 YEARS
100.0/ 100
METRIC RATING
23rd/ 347
METRIC RANK
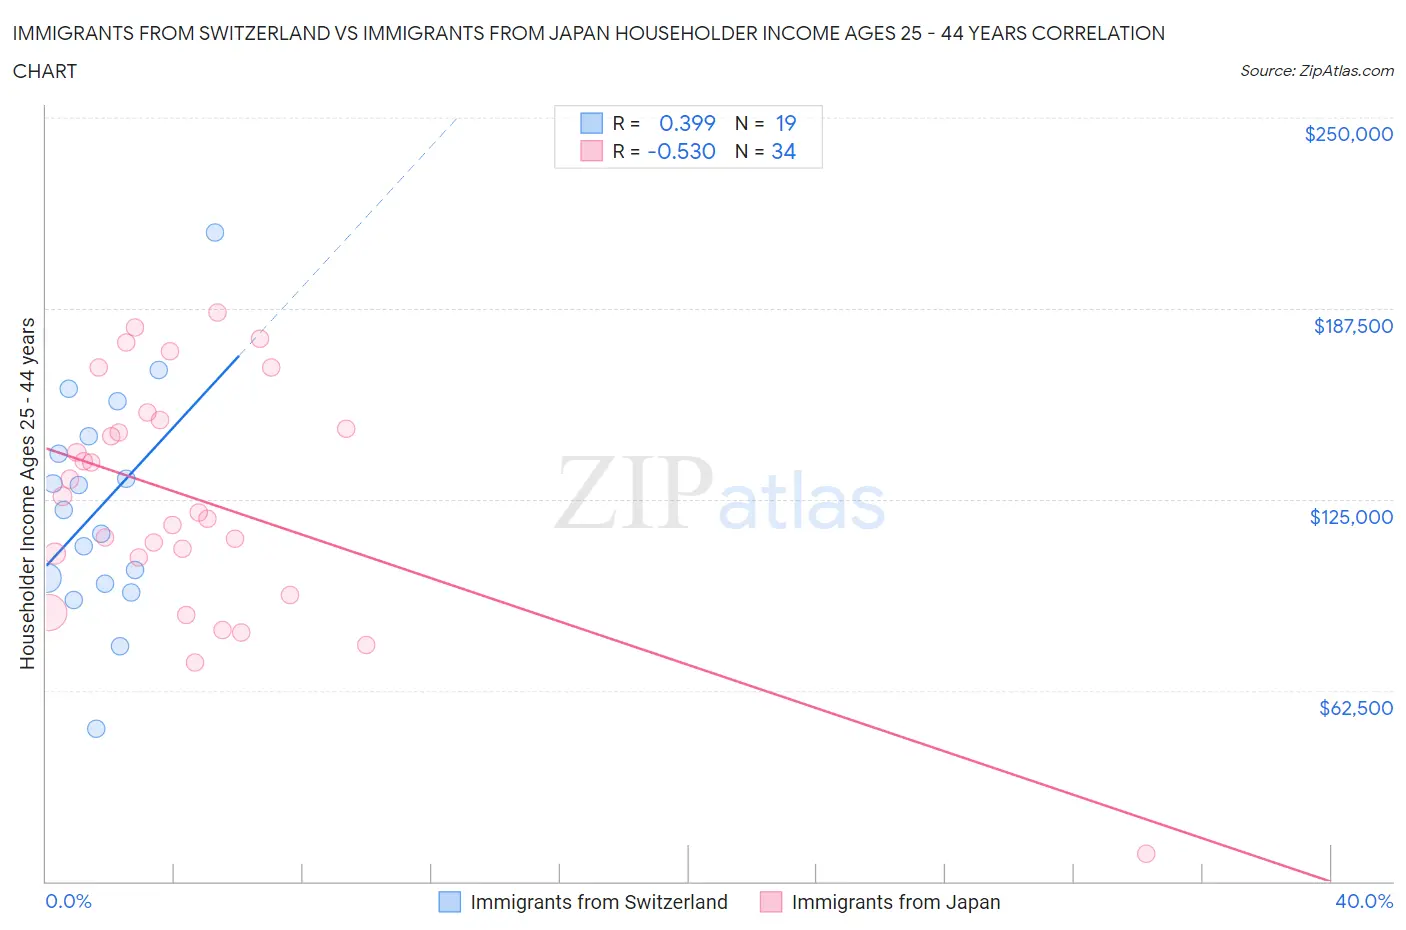
Immigrants from Switzerland vs Immigrants from Japan Householder Income Ages 25 - 44 years Correlation Chart
The statistical analysis conducted on geographies consisting of 147,830,910 people shows a mild positive correlation between the proportion of Immigrants from Switzerland and household income with householder between the ages 25 and 44 in the United States with a correlation coefficient (R) of 0.399 and weighted average of $109,185. Similarly, the statistical analysis conducted on geographies consisting of 339,467,861 people shows a substantial negative correlation between the proportion of Immigrants from Japan and household income with householder between the ages 25 and 44 in the United States with a correlation coefficient (R) of -0.530 and weighted average of $112,228, a difference of 2.8%.
Householder Income Ages 25 - 44 years Correlation Summary
| Measurement | Immigrants from Switzerland | Immigrants from Japan |
| Minimum | $50,066 | $8,816 |
| Maximum | $212,344 | $186,269 |
| Range | $162,278 | $177,453 |
| Mean | $122,767 | $125,080 |
| Median | $121,552 | $123,352 |
| Interquartile 25% (IQ1) | $97,500 | $106,100 |
| Interquartile 75% (IQ3) | $145,628 | $150,805 |
| Interquartile Range (IQR) | $48,128 | $44,706 |
| Standard Deviation (Sample) | $37,027 | $38,741 |
| Standard Deviation (Population) | $36,040 | $38,167 |
Demographics Similar to Immigrants from Switzerland and Immigrants from Japan by Householder Income Ages 25 - 44 years
In terms of householder income ages 25 - 44 years, the demographic groups most similar to Immigrants from Switzerland are Bolivian ($109,372, a difference of 0.17%), Latvian ($108,926, a difference of 0.24%), Bhutanese ($109,520, a difference of 0.31%), Immigrants from Russia ($108,751, a difference of 0.40%), and Immigrants from Sri Lanka ($109,741, a difference of 0.51%). Similarly, the demographic groups most similar to Immigrants from Japan are Immigrants from Sweden ($112,010, a difference of 0.19%), Immigrants from Belgium ($112,575, a difference of 0.31%), Asian ($112,666, a difference of 0.39%), Immigrants from Northern Europe ($111,676, a difference of 0.49%), and Immigrants from Korea ($113,401, a difference of 1.1%).
| Demographics | Rating | Rank | Householder Income Ages 25 - 44 years |
| Burmese | 100.0 /100 | #19 | Exceptional $113,701 |
| Immigrants | Korea | 100.0 /100 | #20 | Exceptional $113,401 |
| Asians | 100.0 /100 | #21 | Exceptional $112,666 |
| Immigrants | Belgium | 100.0 /100 | #22 | Exceptional $112,575 |
| Immigrants | Japan | 100.0 /100 | #23 | Exceptional $112,228 |
| Immigrants | Sweden | 100.0 /100 | #24 | Exceptional $112,010 |
| Immigrants | Northern Europe | 100.0 /100 | #25 | Exceptional $111,676 |
| Immigrants | Asia | 100.0 /100 | #26 | Exceptional $110,787 |
| Russians | 100.0 /100 | #27 | Exceptional $110,398 |
| Immigrants | Denmark | 100.0 /100 | #28 | Exceptional $110,363 |
| Turks | 100.0 /100 | #29 | Exceptional $110,318 |
| Immigrants | Greece | 100.0 /100 | #30 | Exceptional $110,103 |
| Maltese | 100.0 /100 | #31 | Exceptional $110,064 |
| Immigrants | Sri Lanka | 100.0 /100 | #32 | Exceptional $109,741 |
| Bhutanese | 100.0 /100 | #33 | Exceptional $109,520 |
| Bolivians | 100.0 /100 | #34 | Exceptional $109,372 |
| Immigrants | Switzerland | 100.0 /100 | #35 | Exceptional $109,185 |
| Latvians | 100.0 /100 | #36 | Exceptional $108,926 |
| Immigrants | Russia | 100.0 /100 | #37 | Exceptional $108,751 |
| Soviet Union | 100.0 /100 | #38 | Exceptional $108,457 |
| Immigrants | France | 99.9 /100 | #39 | Exceptional $108,257 |