Tongan vs Immigrants from Japan Householder Income Ages 25 - 44 years
COMPARE
Tongan
Immigrants from Japan
Householder Income Ages 25 - 44 years
Householder Income Ages 25 - 44 years Comparison
Tongans
Immigrants from Japan
$99,604
HOUSEHOLDER INCOME AGES 25 - 44 YEARS
94.2/ 100
METRIC RATING
113th/ 347
METRIC RANK
$112,228
HOUSEHOLDER INCOME AGES 25 - 44 YEARS
100.0/ 100
METRIC RATING
23rd/ 347
METRIC RANK
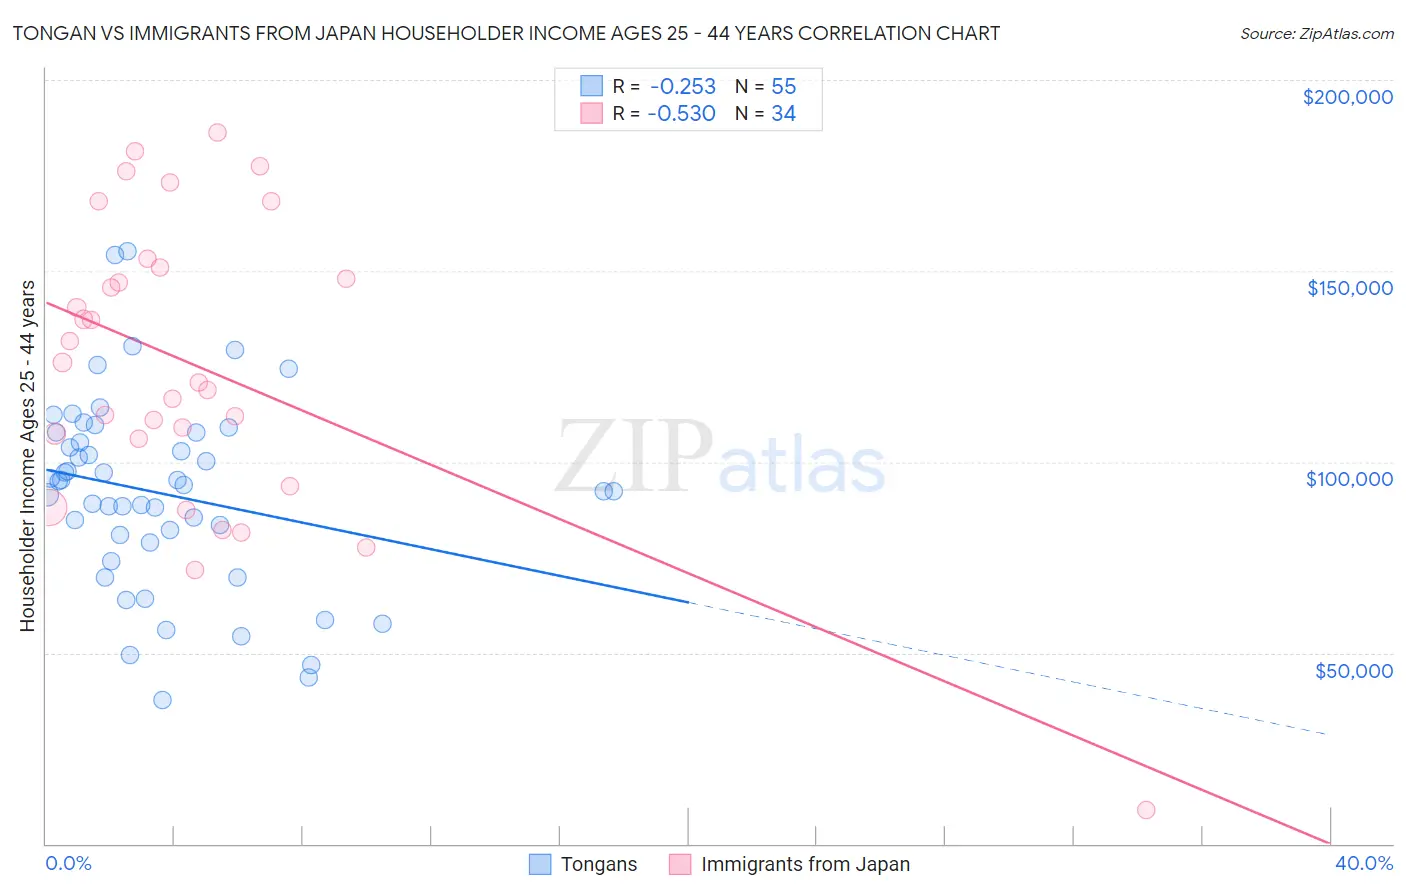
Tongan vs Immigrants from Japan Householder Income Ages 25 - 44 years Correlation Chart
The statistical analysis conducted on geographies consisting of 102,745,884 people shows a weak negative correlation between the proportion of Tongans and household income with householder between the ages 25 and 44 in the United States with a correlation coefficient (R) of -0.253 and weighted average of $99,604. Similarly, the statistical analysis conducted on geographies consisting of 339,467,861 people shows a substantial negative correlation between the proportion of Immigrants from Japan and household income with householder between the ages 25 and 44 in the United States with a correlation coefficient (R) of -0.530 and weighted average of $112,228, a difference of 12.7%.
Householder Income Ages 25 - 44 years Correlation Summary
| Measurement | Tongan | Immigrants from Japan |
| Minimum | $37,778 | $8,816 |
| Maximum | $155,050 | $186,269 |
| Range | $117,272 | $177,453 |
| Mean | $91,685 | $125,080 |
| Median | $93,885 | $123,352 |
| Interquartile 25% (IQ1) | $78,849 | $106,100 |
| Interquartile 75% (IQ3) | $107,550 | $150,805 |
| Interquartile Range (IQR) | $28,701 | $44,706 |
| Standard Deviation (Sample) | $25,126 | $38,741 |
| Standard Deviation (Population) | $24,896 | $38,167 |
Similar Demographics by Householder Income Ages 25 - 44 years
Demographics Similar to Tongans by Householder Income Ages 25 - 44 years
In terms of householder income ages 25 - 44 years, the demographic groups most similar to Tongans are Polish ($99,685, a difference of 0.080%), Immigrants from Western Asia ($99,516, a difference of 0.090%), Carpatho Rusyn ($99,449, a difference of 0.16%), Portuguese ($99,429, a difference of 0.18%), and Chilean ($99,900, a difference of 0.30%).
| Demographics | Rating | Rank | Householder Income Ages 25 - 44 years |
| Immigrants | Brazil | 96.5 /100 | #106 | Exceptional $100,534 |
| Northern Europeans | 96.3 /100 | #107 | Exceptional $100,457 |
| Immigrants | South Eastern Asia | 96.0 /100 | #108 | Exceptional $100,283 |
| Immigrants | North Macedonia | 95.6 /100 | #109 | Exceptional $100,101 |
| Immigrants | Afghanistan | 95.3 /100 | #110 | Exceptional $99,977 |
| Chileans | 95.1 /100 | #111 | Exceptional $99,900 |
| Poles | 94.5 /100 | #112 | Exceptional $99,685 |
| Tongans | 94.2 /100 | #113 | Exceptional $99,604 |
| Immigrants | Western Asia | 94.0 /100 | #114 | Exceptional $99,516 |
| Carpatho Rusyns | 93.7 /100 | #115 | Exceptional $99,449 |
| Portuguese | 93.7 /100 | #116 | Exceptional $99,429 |
| Immigrants | Northern Africa | 93.0 /100 | #117 | Exceptional $99,232 |
| Syrians | 92.9 /100 | #118 | Exceptional $99,215 |
| Jordanians | 92.8 /100 | #119 | Exceptional $99,186 |
| Swedes | 92.7 /100 | #120 | Exceptional $99,136 |
Demographics Similar to Immigrants from Japan by Householder Income Ages 25 - 44 years
In terms of householder income ages 25 - 44 years, the demographic groups most similar to Immigrants from Japan are Immigrants from Sweden ($112,010, a difference of 0.19%), Immigrants from Belgium ($112,575, a difference of 0.31%), Asian ($112,666, a difference of 0.39%), Immigrants from Northern Europe ($111,676, a difference of 0.49%), and Immigrants from Korea ($113,401, a difference of 1.1%).
| Demographics | Rating | Rank | Householder Income Ages 25 - 44 years |
| Cypriots | 100.0 /100 | #16 | Exceptional $116,364 |
| Immigrants | Australia | 100.0 /100 | #17 | Exceptional $115,947 |
| Eastern Europeans | 100.0 /100 | #18 | Exceptional $114,523 |
| Burmese | 100.0 /100 | #19 | Exceptional $113,701 |
| Immigrants | Korea | 100.0 /100 | #20 | Exceptional $113,401 |
| Asians | 100.0 /100 | #21 | Exceptional $112,666 |
| Immigrants | Belgium | 100.0 /100 | #22 | Exceptional $112,575 |
| Immigrants | Japan | 100.0 /100 | #23 | Exceptional $112,228 |
| Immigrants | Sweden | 100.0 /100 | #24 | Exceptional $112,010 |
| Immigrants | Northern Europe | 100.0 /100 | #25 | Exceptional $111,676 |
| Immigrants | Asia | 100.0 /100 | #26 | Exceptional $110,787 |
| Russians | 100.0 /100 | #27 | Exceptional $110,398 |
| Immigrants | Denmark | 100.0 /100 | #28 | Exceptional $110,363 |
| Turks | 100.0 /100 | #29 | Exceptional $110,318 |
| Immigrants | Greece | 100.0 /100 | #30 | Exceptional $110,103 |