Immigrants from Switzerland vs Dutch West Indian Householder Income Ages 25 - 44 years
COMPARE
Immigrants from Switzerland
Dutch West Indian
Householder Income Ages 25 - 44 years
Householder Income Ages 25 - 44 years Comparison
Immigrants from Switzerland
Dutch West Indians
$109,185
HOUSEHOLDER INCOME AGES 25 - 44 YEARS
100.0/ 100
METRIC RATING
35th/ 347
METRIC RANK
$77,260
HOUSEHOLDER INCOME AGES 25 - 44 YEARS
0.0/ 100
METRIC RATING
324th/ 347
METRIC RANK
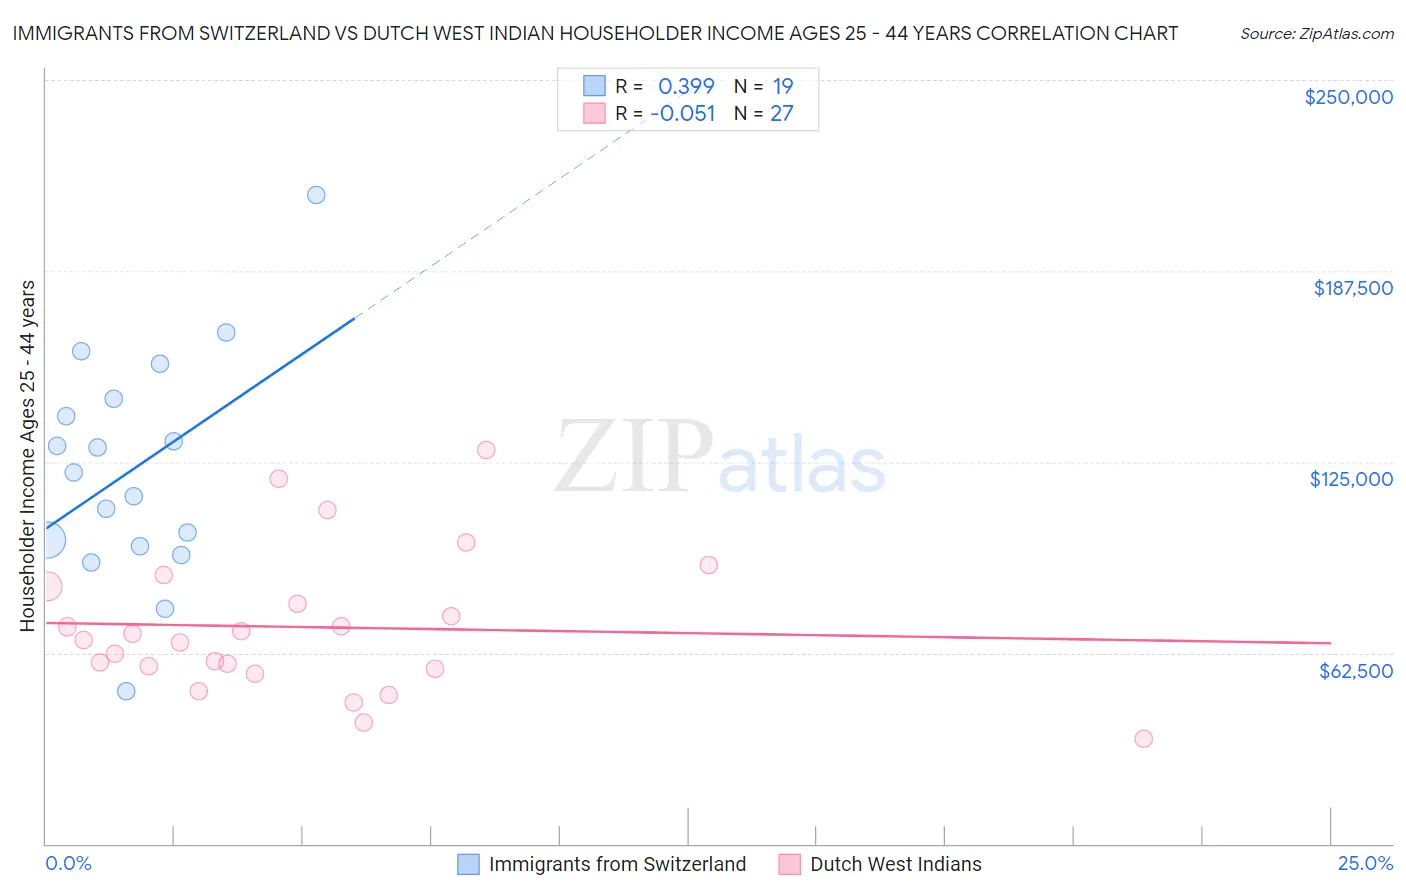
Immigrants from Switzerland vs Dutch West Indian Householder Income Ages 25 - 44 years Correlation Chart
The statistical analysis conducted on geographies consisting of 147,830,910 people shows a mild positive correlation between the proportion of Immigrants from Switzerland and household income with householder between the ages 25 and 44 in the United States with a correlation coefficient (R) of 0.399 and weighted average of $109,185. Similarly, the statistical analysis conducted on geographies consisting of 85,685,681 people shows a slight negative correlation between the proportion of Dutch West Indians and household income with householder between the ages 25 and 44 in the United States with a correlation coefficient (R) of -0.051 and weighted average of $77,260, a difference of 41.3%.
Householder Income Ages 25 - 44 years Correlation Summary
| Measurement | Immigrants from Switzerland | Dutch West Indian |
| Minimum | $50,066 | $34,250 |
| Maximum | $212,344 | $128,750 |
| Range | $162,278 | $94,500 |
| Mean | $122,767 | $70,946 |
| Median | $121,552 | $66,805 |
| Interquartile 25% (IQ1) | $97,500 | $57,188 |
| Interquartile 75% (IQ3) | $145,628 | $84,121 |
| Interquartile Range (IQR) | $48,128 | $26,933 |
| Standard Deviation (Sample) | $37,027 | $23,101 |
| Standard Deviation (Population) | $36,040 | $22,670 |
Similar Demographics by Householder Income Ages 25 - 44 years
Demographics Similar to Immigrants from Switzerland by Householder Income Ages 25 - 44 years
In terms of householder income ages 25 - 44 years, the demographic groups most similar to Immigrants from Switzerland are Bolivian ($109,372, a difference of 0.17%), Latvian ($108,926, a difference of 0.24%), Bhutanese ($109,520, a difference of 0.31%), Immigrants from Russia ($108,751, a difference of 0.40%), and Immigrants from Sri Lanka ($109,741, a difference of 0.51%).
| Demographics | Rating | Rank | Householder Income Ages 25 - 44 years |
| Immigrants | Denmark | 100.0 /100 | #28 | Exceptional $110,363 |
| Turks | 100.0 /100 | #29 | Exceptional $110,318 |
| Immigrants | Greece | 100.0 /100 | #30 | Exceptional $110,103 |
| Maltese | 100.0 /100 | #31 | Exceptional $110,064 |
| Immigrants | Sri Lanka | 100.0 /100 | #32 | Exceptional $109,741 |
| Bhutanese | 100.0 /100 | #33 | Exceptional $109,520 |
| Bolivians | 100.0 /100 | #34 | Exceptional $109,372 |
| Immigrants | Switzerland | 100.0 /100 | #35 | Exceptional $109,185 |
| Latvians | 100.0 /100 | #36 | Exceptional $108,926 |
| Immigrants | Russia | 100.0 /100 | #37 | Exceptional $108,751 |
| Soviet Union | 100.0 /100 | #38 | Exceptional $108,457 |
| Immigrants | France | 99.9 /100 | #39 | Exceptional $108,257 |
| Immigrants | Lithuania | 99.9 /100 | #40 | Exceptional $108,149 |
| Immigrants | Bolivia | 99.9 /100 | #41 | Exceptional $108,128 |
| Australians | 99.9 /100 | #42 | Exceptional $107,912 |
Demographics Similar to Dutch West Indians by Householder Income Ages 25 - 44 years
In terms of householder income ages 25 - 44 years, the demographic groups most similar to Dutch West Indians are Immigrants from Honduras ($77,328, a difference of 0.090%), Sioux ($77,089, a difference of 0.22%), Houma ($77,044, a difference of 0.28%), Immigrants from Bahamas ($76,910, a difference of 0.46%), and Immigrants from Cuba ($76,701, a difference of 0.73%).
| Demographics | Rating | Rank | Householder Income Ages 25 - 44 years |
| U.S. Virgin Islanders | 0.0 /100 | #317 | Tragic $78,911 |
| Immigrants | Mexico | 0.0 /100 | #318 | Tragic $78,809 |
| Hondurans | 0.0 /100 | #319 | Tragic $78,540 |
| Choctaw | 0.0 /100 | #320 | Tragic $78,168 |
| Immigrants | Zaire | 0.0 /100 | #321 | Tragic $78,045 |
| Chickasaw | 0.0 /100 | #322 | Tragic $77,929 |
| Immigrants | Honduras | 0.0 /100 | #323 | Tragic $77,328 |
| Dutch West Indians | 0.0 /100 | #324 | Tragic $77,260 |
| Sioux | 0.0 /100 | #325 | Tragic $77,089 |
| Houma | 0.0 /100 | #326 | Tragic $77,044 |
| Immigrants | Bahamas | 0.0 /100 | #327 | Tragic $76,910 |
| Immigrants | Cuba | 0.0 /100 | #328 | Tragic $76,701 |
| Seminole | 0.0 /100 | #329 | Tragic $76,584 |
| Yakama | 0.0 /100 | #330 | Tragic $76,226 |
| Natives/Alaskans | 0.0 /100 | #331 | Tragic $75,647 |