Immigrants from Switzerland vs Colville Householder Income Ages 25 - 44 years
COMPARE
Immigrants from Switzerland
Colville
Householder Income Ages 25 - 44 years
Householder Income Ages 25 - 44 years Comparison
Immigrants from Switzerland
Colville
$109,185
HOUSEHOLDER INCOME AGES 25 - 44 YEARS
100.0/ 100
METRIC RATING
35th/ 347
METRIC RANK
$82,604
HOUSEHOLDER INCOME AGES 25 - 44 YEARS
0.1/ 100
METRIC RATING
280th/ 347
METRIC RANK
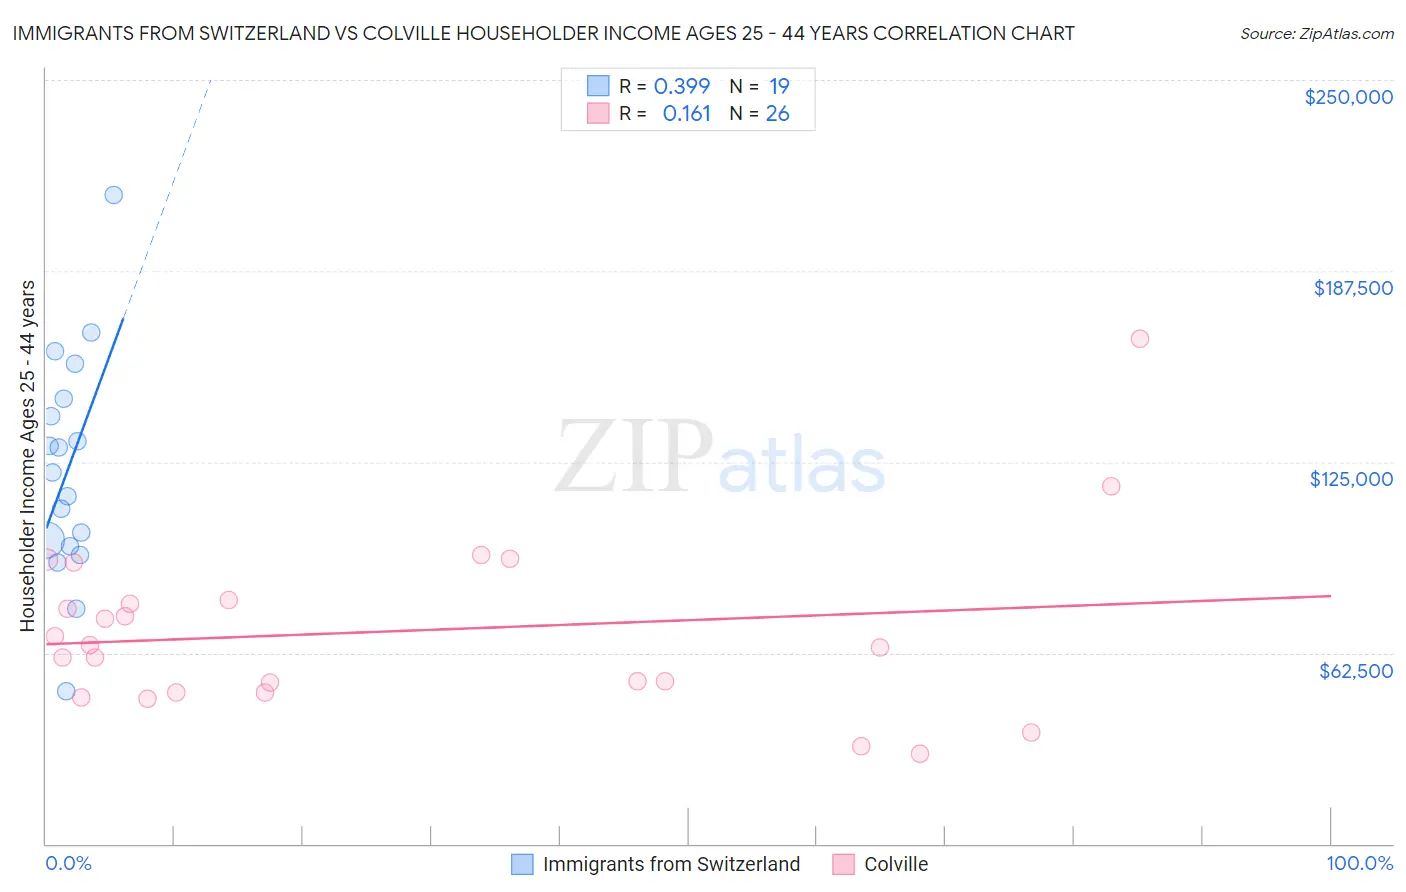
Immigrants from Switzerland vs Colville Householder Income Ages 25 - 44 years Correlation Chart
The statistical analysis conducted on geographies consisting of 147,830,910 people shows a mild positive correlation between the proportion of Immigrants from Switzerland and household income with householder between the ages 25 and 44 in the United States with a correlation coefficient (R) of 0.399 and weighted average of $109,185. Similarly, the statistical analysis conducted on geographies consisting of 34,657,772 people shows a poor positive correlation between the proportion of Colville and household income with householder between the ages 25 and 44 in the United States with a correlation coefficient (R) of 0.161 and weighted average of $82,604, a difference of 32.2%.
Householder Income Ages 25 - 44 years Correlation Summary
| Measurement | Immigrants from Switzerland | Colville |
| Minimum | $50,066 | $29,375 |
| Maximum | $212,344 | $165,278 |
| Range | $162,278 | $135,903 |
| Mean | $122,767 | $69,577 |
| Median | $121,552 | $64,641 |
| Interquartile 25% (IQ1) | $97,500 | $49,583 |
| Interquartile 75% (IQ3) | $145,628 | $79,688 |
| Interquartile Range (IQR) | $48,128 | $30,105 |
| Standard Deviation (Sample) | $37,027 | $28,891 |
| Standard Deviation (Population) | $36,040 | $28,330 |
Similar Demographics by Householder Income Ages 25 - 44 years
Demographics Similar to Immigrants from Switzerland by Householder Income Ages 25 - 44 years
In terms of householder income ages 25 - 44 years, the demographic groups most similar to Immigrants from Switzerland are Bolivian ($109,372, a difference of 0.17%), Latvian ($108,926, a difference of 0.24%), Bhutanese ($109,520, a difference of 0.31%), Immigrants from Russia ($108,751, a difference of 0.40%), and Immigrants from Sri Lanka ($109,741, a difference of 0.51%).
| Demographics | Rating | Rank | Householder Income Ages 25 - 44 years |
| Immigrants | Denmark | 100.0 /100 | #28 | Exceptional $110,363 |
| Turks | 100.0 /100 | #29 | Exceptional $110,318 |
| Immigrants | Greece | 100.0 /100 | #30 | Exceptional $110,103 |
| Maltese | 100.0 /100 | #31 | Exceptional $110,064 |
| Immigrants | Sri Lanka | 100.0 /100 | #32 | Exceptional $109,741 |
| Bhutanese | 100.0 /100 | #33 | Exceptional $109,520 |
| Bolivians | 100.0 /100 | #34 | Exceptional $109,372 |
| Immigrants | Switzerland | 100.0 /100 | #35 | Exceptional $109,185 |
| Latvians | 100.0 /100 | #36 | Exceptional $108,926 |
| Immigrants | Russia | 100.0 /100 | #37 | Exceptional $108,751 |
| Soviet Union | 100.0 /100 | #38 | Exceptional $108,457 |
| Immigrants | France | 99.9 /100 | #39 | Exceptional $108,257 |
| Immigrants | Lithuania | 99.9 /100 | #40 | Exceptional $108,149 |
| Immigrants | Bolivia | 99.9 /100 | #41 | Exceptional $108,128 |
| Australians | 99.9 /100 | #42 | Exceptional $107,912 |
Demographics Similar to Colville by Householder Income Ages 25 - 44 years
In terms of householder income ages 25 - 44 years, the demographic groups most similar to Colville are Pima ($82,821, a difference of 0.26%), Cajun ($82,393, a difference of 0.26%), Senegalese ($82,852, a difference of 0.30%), Central American Indian ($82,355, a difference of 0.30%), and Guatemalan ($82,331, a difference of 0.33%).
| Demographics | Rating | Rank | Householder Income Ages 25 - 44 years |
| Iroquois | 0.2 /100 | #273 | Tragic $83,682 |
| Marshallese | 0.2 /100 | #274 | Tragic $83,575 |
| Immigrants | Jamaica | 0.2 /100 | #275 | Tragic $83,298 |
| Immigrants | Belize | 0.2 /100 | #276 | Tragic $83,141 |
| Paiute | 0.2 /100 | #277 | Tragic $82,984 |
| Senegalese | 0.2 /100 | #278 | Tragic $82,852 |
| Pima | 0.1 /100 | #279 | Tragic $82,821 |
| Colville | 0.1 /100 | #280 | Tragic $82,604 |
| Cajuns | 0.1 /100 | #281 | Tragic $82,393 |
| Central American Indians | 0.1 /100 | #282 | Tragic $82,355 |
| Guatemalans | 0.1 /100 | #283 | Tragic $82,331 |
| Immigrants | Middle Africa | 0.1 /100 | #284 | Tragic $82,254 |
| Immigrants | Somalia | 0.1 /100 | #285 | Tragic $82,188 |
| Ute | 0.1 /100 | #286 | Tragic $82,166 |
| Immigrants | Latin America | 0.1 /100 | #287 | Tragic $82,166 |