Immigrants from Switzerland vs Immigrants from Japan Single Male Poverty
COMPARE
Immigrants from Switzerland
Immigrants from Japan
Single Male Poverty
Single Male Poverty Comparison
Immigrants from Switzerland
Immigrants from Japan
12.8%
SINGLE MALE POVERTY
43.1/ 100
METRIC RATING
178th/ 347
METRIC RANK
11.3%
SINGLE MALE POVERTY
100.0/ 100
METRIC RATING
26th/ 347
METRIC RANK
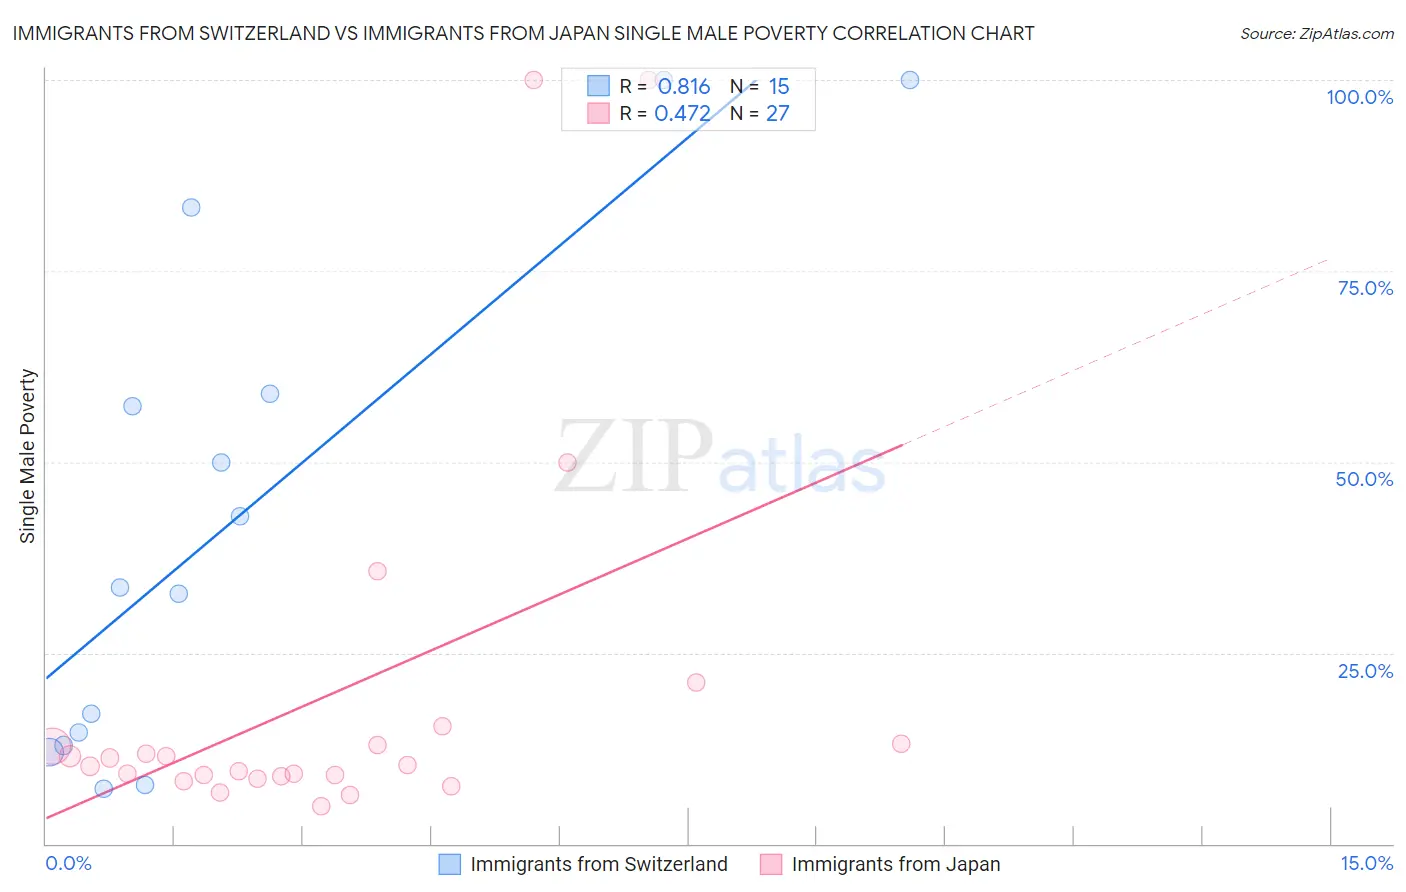
Immigrants from Switzerland vs Immigrants from Japan Single Male Poverty Correlation Chart
The statistical analysis conducted on geographies consisting of 136,371,687 people shows a very strong positive correlation between the proportion of Immigrants from Switzerland and poverty level among single males in the United States with a correlation coefficient (R) of 0.816 and weighted average of 12.8%. Similarly, the statistical analysis conducted on geographies consisting of 305,055,385 people shows a moderate positive correlation between the proportion of Immigrants from Japan and poverty level among single males in the United States with a correlation coefficient (R) of 0.472 and weighted average of 11.3%, a difference of 13.7%.
Single Male Poverty Correlation Summary
| Measurement | Immigrants from Switzerland | Immigrants from Japan |
| Minimum | 7.2% | 4.9% |
| Maximum | 100.0% | 100.0% |
| Range | 92.8% | 95.1% |
| Mean | 42.0% | 19.4% |
| Median | 33.6% | 10.3% |
| Interquartile 25% (IQ1) | 12.9% | 8.8% |
| Interquartile 75% (IQ3) | 58.9% | 13.1% |
| Interquartile Range (IQR) | 46.0% | 4.3% |
| Standard Deviation (Sample) | 32.4% | 25.1% |
| Standard Deviation (Population) | 31.3% | 24.6% |
Similar Demographics by Single Male Poverty
Demographics Similar to Immigrants from Switzerland by Single Male Poverty
In terms of single male poverty, the demographic groups most similar to Immigrants from Switzerland are Immigrants from Canada (12.8%, a difference of 0.090%), Israeli (12.9%, a difference of 0.11%), Syrian (12.8%, a difference of 0.28%), Immigrants from North America (12.9%, a difference of 0.29%), and Panamanian (12.9%, a difference of 0.30%).
| Demographics | Rating | Rank | Single Male Poverty |
| South Africans | 51.5 /100 | #171 | Average 12.8% |
| Danes | 51.4 /100 | #172 | Average 12.8% |
| Immigrants | St. Vincent and the Grenadines | 50.9 /100 | #173 | Average 12.8% |
| Costa Ricans | 50.0 /100 | #174 | Average 12.8% |
| Croatians | 48.9 /100 | #175 | Average 12.8% |
| Syrians | 48.4 /100 | #176 | Average 12.8% |
| Immigrants | Canada | 44.8 /100 | #177 | Average 12.8% |
| Immigrants | Switzerland | 43.1 /100 | #178 | Average 12.8% |
| Israelis | 41.0 /100 | #179 | Average 12.9% |
| Immigrants | North America | 37.7 /100 | #180 | Fair 12.9% |
| Panamanians | 37.6 /100 | #181 | Fair 12.9% |
| Moroccans | 36.8 /100 | #182 | Fair 12.9% |
| Immigrants | West Indies | 33.0 /100 | #183 | Fair 12.9% |
| Immigrants | Trinidad and Tobago | 32.5 /100 | #184 | Fair 12.9% |
| Norwegians | 32.0 /100 | #185 | Fair 12.9% |
Demographics Similar to Immigrants from Japan by Single Male Poverty
In terms of single male poverty, the demographic groups most similar to Immigrants from Japan are Maltese (11.3%, a difference of 0.33%), Indian (Asian) (11.3%, a difference of 0.35%), Bolivian (11.2%, a difference of 0.55%), Immigrants from China (11.4%, a difference of 0.71%), and Immigrants from Pakistan (11.2%, a difference of 0.76%).
| Demographics | Rating | Rank | Single Male Poverty |
| Immigrants | Moldova | 100.0 /100 | #19 | Exceptional 11.2% |
| Ethiopians | 100.0 /100 | #20 | Exceptional 11.2% |
| Asians | 100.0 /100 | #21 | Exceptional 11.2% |
| Immigrants | Pakistan | 100.0 /100 | #22 | Exceptional 11.2% |
| Bolivians | 100.0 /100 | #23 | Exceptional 11.2% |
| Indians (Asian) | 100.0 /100 | #24 | Exceptional 11.3% |
| Maltese | 100.0 /100 | #25 | Exceptional 11.3% |
| Immigrants | Japan | 100.0 /100 | #26 | Exceptional 11.3% |
| Immigrants | China | 100.0 /100 | #27 | Exceptional 11.4% |
| Immigrants | Asia | 100.0 /100 | #28 | Exceptional 11.4% |
| Immigrants | Egypt | 100.0 /100 | #29 | Exceptional 11.4% |
| Iranians | 100.0 /100 | #30 | Exceptional 11.4% |
| Immigrants | Iran | 100.0 /100 | #31 | Exceptional 11.4% |
| Immigrants | Eastern Asia | 100.0 /100 | #32 | Exceptional 11.4% |
| Immigrants | Vietnam | 100.0 /100 | #33 | Exceptional 11.4% |