Immigrants from Switzerland vs Greek Householder Income Ages 25 - 44 years
COMPARE
Immigrants from Switzerland
Greek
Householder Income Ages 25 - 44 years
Householder Income Ages 25 - 44 years Comparison
Immigrants from Switzerland
Greeks
$109,185
HOUSEHOLDER INCOME AGES 25 - 44 YEARS
100.0/ 100
METRIC RATING
35th/ 347
METRIC RANK
$106,457
HOUSEHOLDER INCOME AGES 25 - 44 YEARS
99.9/ 100
METRIC RATING
55th/ 347
METRIC RANK
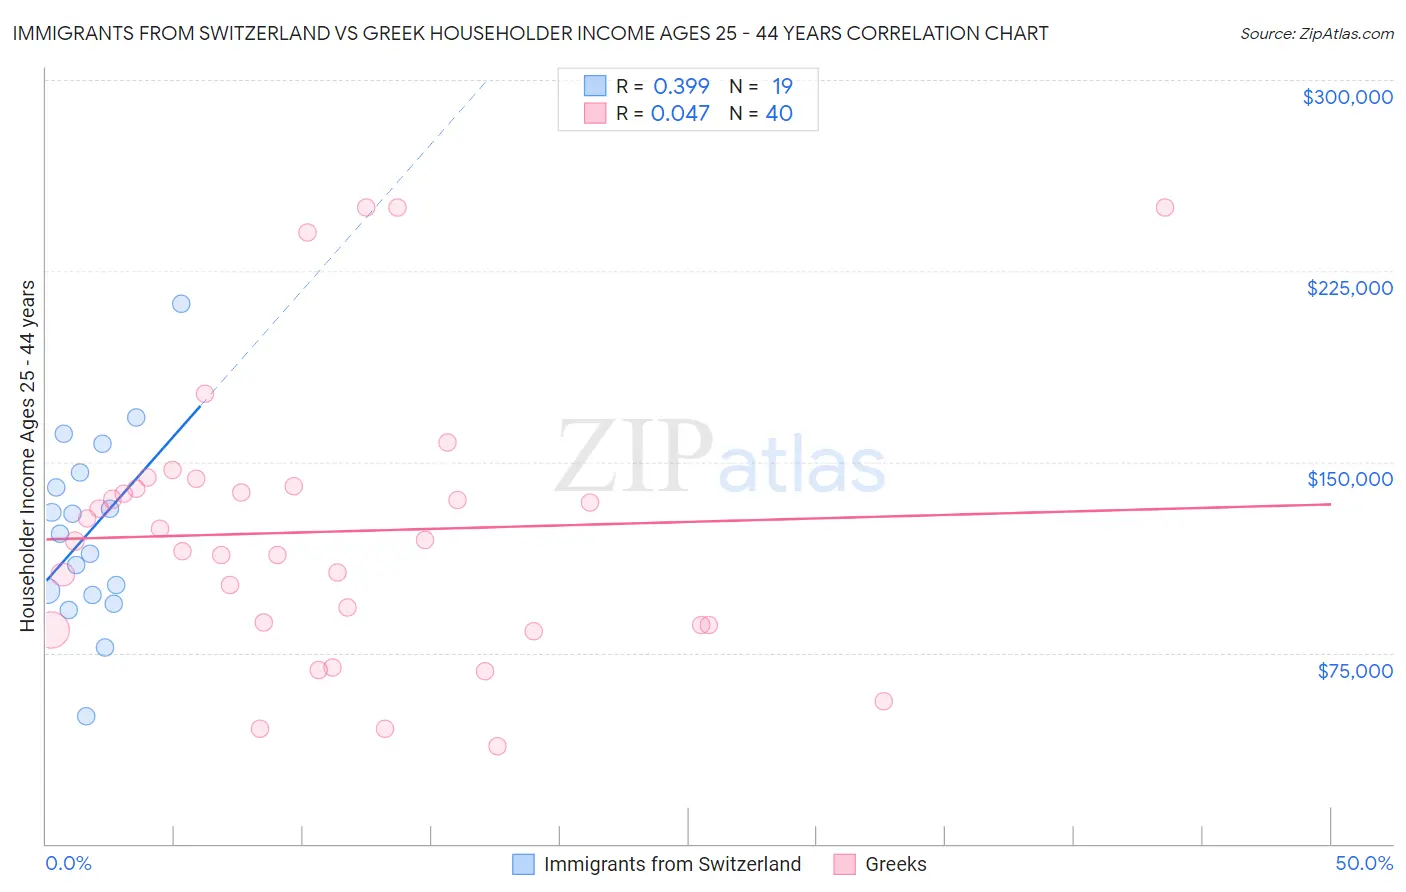
Immigrants from Switzerland vs Greek Householder Income Ages 25 - 44 years Correlation Chart
The statistical analysis conducted on geographies consisting of 147,830,910 people shows a mild positive correlation between the proportion of Immigrants from Switzerland and household income with householder between the ages 25 and 44 in the United States with a correlation coefficient (R) of 0.399 and weighted average of $109,185. Similarly, the statistical analysis conducted on geographies consisting of 480,636,486 people shows no correlation between the proportion of Greeks and household income with householder between the ages 25 and 44 in the United States with a correlation coefficient (R) of 0.047 and weighted average of $106,457, a difference of 2.6%.
Householder Income Ages 25 - 44 years Correlation Summary
| Measurement | Immigrants from Switzerland | Greek |
| Minimum | $50,066 | $38,250 |
| Maximum | $212,344 | $250,001 |
| Range | $162,278 | $211,751 |
| Mean | $122,767 | $122,593 |
| Median | $121,552 | $119,219 |
| Interquartile 25% (IQ1) | $97,500 | $85,764 |
| Interquartile 75% (IQ3) | $145,628 | $139,981 |
| Interquartile Range (IQR) | $48,128 | $54,217 |
| Standard Deviation (Sample) | $37,027 | $53,394 |
| Standard Deviation (Population) | $36,040 | $52,723 |
Demographics Similar to Immigrants from Switzerland and Greeks by Householder Income Ages 25 - 44 years
In terms of householder income ages 25 - 44 years, the demographic groups most similar to Immigrants from Switzerland are Latvian ($108,926, a difference of 0.24%), Immigrants from Russia ($108,751, a difference of 0.40%), Soviet Union ($108,457, a difference of 0.67%), Immigrants from France ($108,257, a difference of 0.86%), and Immigrants from Lithuania ($108,149, a difference of 0.96%). Similarly, the demographic groups most similar to Greeks are Paraguayan ($106,615, a difference of 0.15%), Immigrants from Norway ($106,629, a difference of 0.16%), Immigrants from Europe ($106,817, a difference of 0.34%), Immigrants from Czechoslovakia ($106,888, a difference of 0.41%), and Cambodian ($107,148, a difference of 0.65%).
| Demographics | Rating | Rank | Householder Income Ages 25 - 44 years |
| Immigrants | Switzerland | 100.0 /100 | #35 | Exceptional $109,185 |
| Latvians | 100.0 /100 | #36 | Exceptional $108,926 |
| Immigrants | Russia | 100.0 /100 | #37 | Exceptional $108,751 |
| Soviet Union | 100.0 /100 | #38 | Exceptional $108,457 |
| Immigrants | France | 99.9 /100 | #39 | Exceptional $108,257 |
| Immigrants | Lithuania | 99.9 /100 | #40 | Exceptional $108,149 |
| Immigrants | Bolivia | 99.9 /100 | #41 | Exceptional $108,128 |
| Australians | 99.9 /100 | #42 | Exceptional $107,912 |
| Immigrants | Malaysia | 99.9 /100 | #43 | Exceptional $107,650 |
| Immigrants | Indonesia | 99.9 /100 | #44 | Exceptional $107,627 |
| Israelis | 99.9 /100 | #45 | Exceptional $107,579 |
| Immigrants | Belarus | 99.9 /100 | #46 | Exceptional $107,393 |
| Estonians | 99.9 /100 | #47 | Exceptional $107,269 |
| Bulgarians | 99.9 /100 | #48 | Exceptional $107,264 |
| Immigrants | Turkey | 99.9 /100 | #49 | Exceptional $107,258 |
| Cambodians | 99.9 /100 | #50 | Exceptional $107,148 |
| Immigrants | Czechoslovakia | 99.9 /100 | #51 | Exceptional $106,888 |
| Immigrants | Europe | 99.9 /100 | #52 | Exceptional $106,817 |
| Immigrants | Norway | 99.9 /100 | #53 | Exceptional $106,629 |
| Paraguayans | 99.9 /100 | #54 | Exceptional $106,615 |
| Greeks | 99.9 /100 | #55 | Exceptional $106,457 |