Immigrants from Switzerland vs Palestinian Householder Income Ages 25 - 44 years
COMPARE
Immigrants from Switzerland
Palestinian
Householder Income Ages 25 - 44 years
Householder Income Ages 25 - 44 years Comparison
Immigrants from Switzerland
Palestinians
$109,185
HOUSEHOLDER INCOME AGES 25 - 44 YEARS
100.0/ 100
METRIC RATING
35th/ 347
METRIC RANK
$98,777
HOUSEHOLDER INCOME AGES 25 - 44 YEARS
91.2/ 100
METRIC RATING
123rd/ 347
METRIC RANK
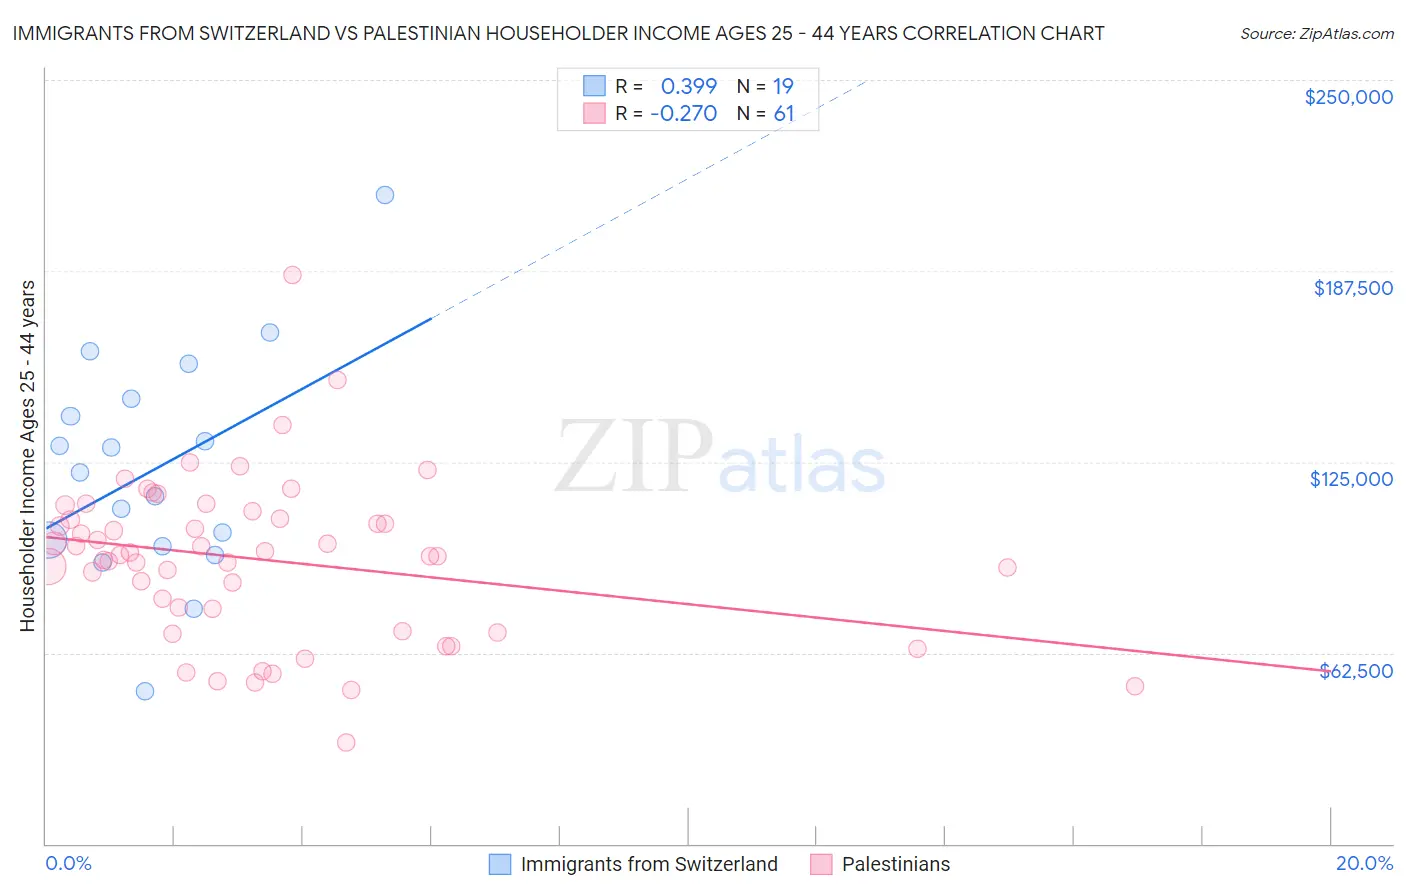
Immigrants from Switzerland vs Palestinian Householder Income Ages 25 - 44 years Correlation Chart
The statistical analysis conducted on geographies consisting of 147,830,910 people shows a mild positive correlation between the proportion of Immigrants from Switzerland and household income with householder between the ages 25 and 44 in the United States with a correlation coefficient (R) of 0.399 and weighted average of $109,185. Similarly, the statistical analysis conducted on geographies consisting of 216,290,532 people shows a weak negative correlation between the proportion of Palestinians and household income with householder between the ages 25 and 44 in the United States with a correlation coefficient (R) of -0.270 and weighted average of $98,777, a difference of 10.5%.
Householder Income Ages 25 - 44 years Correlation Summary
| Measurement | Immigrants from Switzerland | Palestinian |
| Minimum | $50,066 | $33,077 |
| Maximum | $212,344 | $186,111 |
| Range | $162,278 | $153,034 |
| Mean | $122,767 | $93,023 |
| Median | $121,552 | $94,675 |
| Interquartile 25% (IQ1) | $97,500 | $73,167 |
| Interquartile 75% (IQ3) | $145,628 | $107,616 |
| Interquartile Range (IQR) | $48,128 | $34,449 |
| Standard Deviation (Sample) | $37,027 | $26,611 |
| Standard Deviation (Population) | $36,040 | $26,392 |
Similar Demographics by Householder Income Ages 25 - 44 years
Demographics Similar to Immigrants from Switzerland by Householder Income Ages 25 - 44 years
In terms of householder income ages 25 - 44 years, the demographic groups most similar to Immigrants from Switzerland are Bolivian ($109,372, a difference of 0.17%), Latvian ($108,926, a difference of 0.24%), Bhutanese ($109,520, a difference of 0.31%), Immigrants from Russia ($108,751, a difference of 0.40%), and Immigrants from Sri Lanka ($109,741, a difference of 0.51%).
| Demographics | Rating | Rank | Householder Income Ages 25 - 44 years |
| Immigrants | Denmark | 100.0 /100 | #28 | Exceptional $110,363 |
| Turks | 100.0 /100 | #29 | Exceptional $110,318 |
| Immigrants | Greece | 100.0 /100 | #30 | Exceptional $110,103 |
| Maltese | 100.0 /100 | #31 | Exceptional $110,064 |
| Immigrants | Sri Lanka | 100.0 /100 | #32 | Exceptional $109,741 |
| Bhutanese | 100.0 /100 | #33 | Exceptional $109,520 |
| Bolivians | 100.0 /100 | #34 | Exceptional $109,372 |
| Immigrants | Switzerland | 100.0 /100 | #35 | Exceptional $109,185 |
| Latvians | 100.0 /100 | #36 | Exceptional $108,926 |
| Immigrants | Russia | 100.0 /100 | #37 | Exceptional $108,751 |
| Soviet Union | 100.0 /100 | #38 | Exceptional $108,457 |
| Immigrants | France | 99.9 /100 | #39 | Exceptional $108,257 |
| Immigrants | Lithuania | 99.9 /100 | #40 | Exceptional $108,149 |
| Immigrants | Bolivia | 99.9 /100 | #41 | Exceptional $108,128 |
| Australians | 99.9 /100 | #42 | Exceptional $107,912 |
Demographics Similar to Palestinians by Householder Income Ages 25 - 44 years
In terms of householder income ages 25 - 44 years, the demographic groups most similar to Palestinians are Immigrants from Uzbekistan ($98,849, a difference of 0.070%), Peruvian ($98,886, a difference of 0.11%), Zimbabwean ($98,586, a difference of 0.19%), Swedish ($99,136, a difference of 0.36%), and Pakistani ($98,401, a difference of 0.38%).
| Demographics | Rating | Rank | Householder Income Ages 25 - 44 years |
| Portuguese | 93.7 /100 | #116 | Exceptional $99,429 |
| Immigrants | Northern Africa | 93.0 /100 | #117 | Exceptional $99,232 |
| Syrians | 92.9 /100 | #118 | Exceptional $99,215 |
| Jordanians | 92.8 /100 | #119 | Exceptional $99,186 |
| Swedes | 92.7 /100 | #120 | Exceptional $99,136 |
| Peruvians | 91.7 /100 | #121 | Exceptional $98,886 |
| Immigrants | Uzbekistan | 91.5 /100 | #122 | Exceptional $98,849 |
| Palestinians | 91.2 /100 | #123 | Exceptional $98,777 |
| Zimbabweans | 90.3 /100 | #124 | Exceptional $98,586 |
| Pakistanis | 89.3 /100 | #125 | Excellent $98,401 |
| British | 89.1 /100 | #126 | Excellent $98,359 |
| Serbians | 88.9 /100 | #127 | Excellent $98,320 |
| Europeans | 88.9 /100 | #128 | Excellent $98,310 |
| Brazilians | 88.6 /100 | #129 | Excellent $98,267 |
| Immigrants | Kuwait | 87.8 /100 | #130 | Excellent $98,122 |