Immigrants from Germany vs Immigrants from Japan Householder Income Ages 25 - 44 years
COMPARE
Immigrants from Germany
Immigrants from Japan
Householder Income Ages 25 - 44 years
Householder Income Ages 25 - 44 years Comparison
Immigrants from Germany
Immigrants from Japan
$95,913
HOUSEHOLDER INCOME AGES 25 - 44 YEARS
67.9/ 100
METRIC RATING
156th/ 347
METRIC RANK
$112,228
HOUSEHOLDER INCOME AGES 25 - 44 YEARS
100.0/ 100
METRIC RATING
23rd/ 347
METRIC RANK
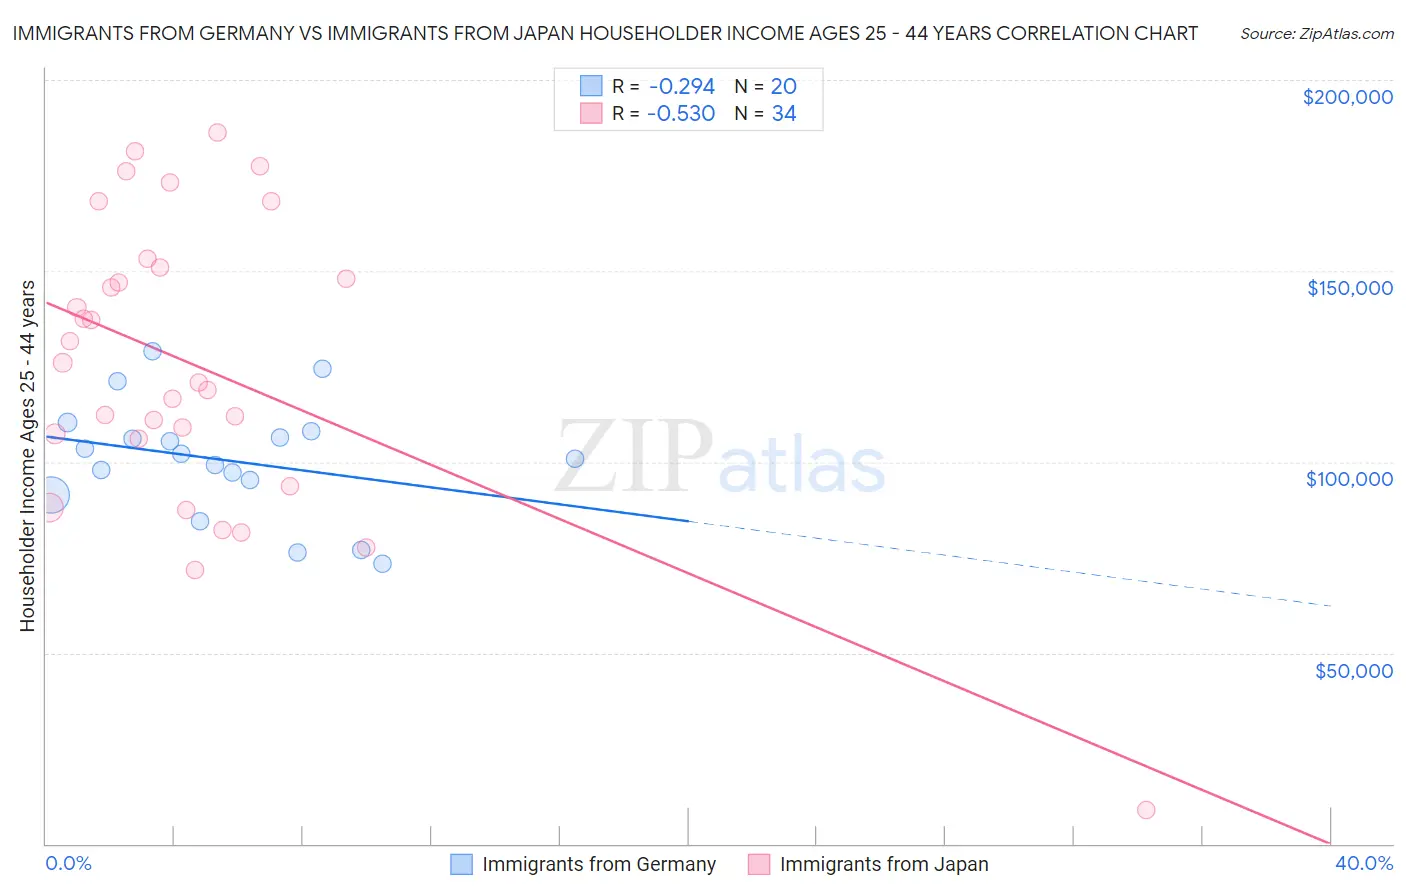
Immigrants from Germany vs Immigrants from Japan Householder Income Ages 25 - 44 years Correlation Chart
The statistical analysis conducted on geographies consisting of 462,354,902 people shows a weak negative correlation between the proportion of Immigrants from Germany and household income with householder between the ages 25 and 44 in the United States with a correlation coefficient (R) of -0.294 and weighted average of $95,913. Similarly, the statistical analysis conducted on geographies consisting of 339,467,861 people shows a substantial negative correlation between the proportion of Immigrants from Japan and household income with householder between the ages 25 and 44 in the United States with a correlation coefficient (R) of -0.530 and weighted average of $112,228, a difference of 17.0%.
Householder Income Ages 25 - 44 years Correlation Summary
| Measurement | Immigrants from Germany | Immigrants from Japan |
| Minimum | $73,472 | $8,816 |
| Maximum | $129,121 | $186,269 |
| Range | $55,649 | $177,453 |
| Mean | $100,474 | $125,080 |
| Median | $101,592 | $123,352 |
| Interquartile 25% (IQ1) | $93,342 | $106,100 |
| Interquartile 75% (IQ3) | $107,107 | $150,805 |
| Interquartile Range (IQR) | $13,765 | $44,706 |
| Standard Deviation (Sample) | $15,097 | $38,741 |
| Standard Deviation (Population) | $14,715 | $38,167 |
Similar Demographics by Householder Income Ages 25 - 44 years
Demographics Similar to Immigrants from Germany by Householder Income Ages 25 - 44 years
In terms of householder income ages 25 - 44 years, the demographic groups most similar to Immigrants from Germany are Moroccan ($96,117, a difference of 0.21%), Immigrants from Uganda ($95,698, a difference of 0.22%), Scandinavian ($95,596, a difference of 0.33%), Costa Rican ($95,565, a difference of 0.36%), and Icelander ($95,560, a difference of 0.37%).
| Demographics | Rating | Rank | Householder Income Ages 25 - 44 years |
| Basques | 76.6 /100 | #149 | Good $96,709 |
| Ugandans | 76.2 /100 | #150 | Good $96,667 |
| Czechs | 74.8 /100 | #151 | Good $96,525 |
| South American Indians | 74.5 /100 | #152 | Good $96,497 |
| Slovenes | 73.9 /100 | #153 | Good $96,439 |
| Slavs | 73.2 /100 | #154 | Good $96,377 |
| Moroccans | 70.3 /100 | #155 | Good $96,117 |
| Immigrants | Germany | 67.9 /100 | #156 | Good $95,913 |
| Immigrants | Uganda | 65.2 /100 | #157 | Good $95,698 |
| Scandinavians | 63.9 /100 | #158 | Good $95,596 |
| Costa Ricans | 63.5 /100 | #159 | Good $95,565 |
| Icelanders | 63.4 /100 | #160 | Good $95,560 |
| Immigrants | Portugal | 62.8 /100 | #161 | Good $95,512 |
| Swiss | 62.8 /100 | #162 | Good $95,511 |
| Immigrants | Saudi Arabia | 62.0 /100 | #163 | Good $95,450 |
Demographics Similar to Immigrants from Japan by Householder Income Ages 25 - 44 years
In terms of householder income ages 25 - 44 years, the demographic groups most similar to Immigrants from Japan are Immigrants from Sweden ($112,010, a difference of 0.19%), Immigrants from Belgium ($112,575, a difference of 0.31%), Asian ($112,666, a difference of 0.39%), Immigrants from Northern Europe ($111,676, a difference of 0.49%), and Immigrants from Korea ($113,401, a difference of 1.1%).
| Demographics | Rating | Rank | Householder Income Ages 25 - 44 years |
| Cypriots | 100.0 /100 | #16 | Exceptional $116,364 |
| Immigrants | Australia | 100.0 /100 | #17 | Exceptional $115,947 |
| Eastern Europeans | 100.0 /100 | #18 | Exceptional $114,523 |
| Burmese | 100.0 /100 | #19 | Exceptional $113,701 |
| Immigrants | Korea | 100.0 /100 | #20 | Exceptional $113,401 |
| Asians | 100.0 /100 | #21 | Exceptional $112,666 |
| Immigrants | Belgium | 100.0 /100 | #22 | Exceptional $112,575 |
| Immigrants | Japan | 100.0 /100 | #23 | Exceptional $112,228 |
| Immigrants | Sweden | 100.0 /100 | #24 | Exceptional $112,010 |
| Immigrants | Northern Europe | 100.0 /100 | #25 | Exceptional $111,676 |
| Immigrants | Asia | 100.0 /100 | #26 | Exceptional $110,787 |
| Russians | 100.0 /100 | #27 | Exceptional $110,398 |
| Immigrants | Denmark | 100.0 /100 | #28 | Exceptional $110,363 |
| Turks | 100.0 /100 | #29 | Exceptional $110,318 |
| Immigrants | Greece | 100.0 /100 | #30 | Exceptional $110,103 |