Iroquois vs Immigrants from Japan Householder Income Ages 25 - 44 years
COMPARE
Iroquois
Immigrants from Japan
Householder Income Ages 25 - 44 years
Householder Income Ages 25 - 44 years Comparison
Iroquois
Immigrants from Japan
$83,682
HOUSEHOLDER INCOME AGES 25 - 44 YEARS
0.2/ 100
METRIC RATING
273rd/ 347
METRIC RANK
$112,228
HOUSEHOLDER INCOME AGES 25 - 44 YEARS
100.0/ 100
METRIC RATING
23rd/ 347
METRIC RANK
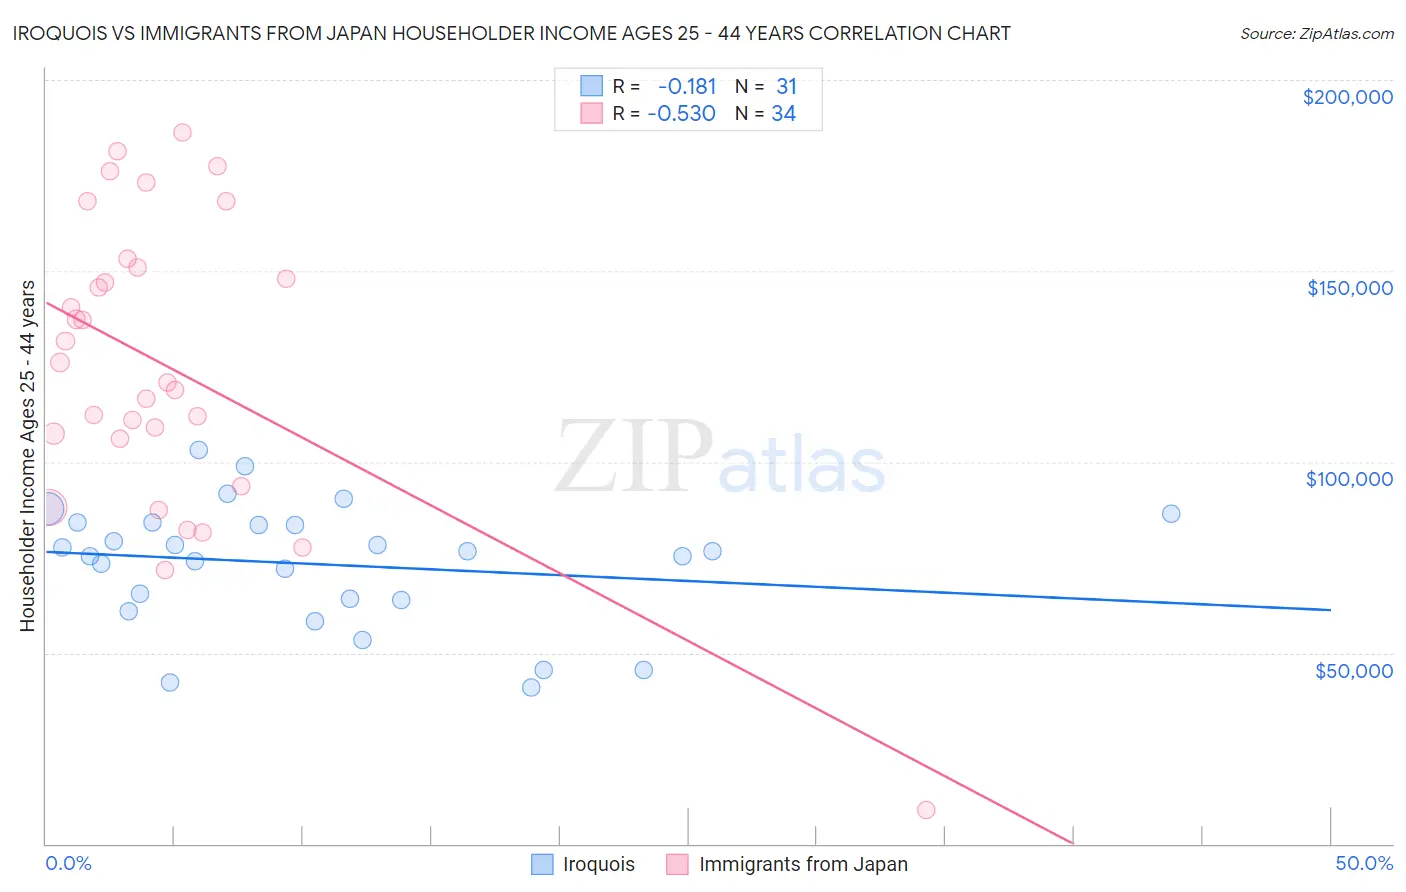
Iroquois vs Immigrants from Japan Householder Income Ages 25 - 44 years Correlation Chart
The statistical analysis conducted on geographies consisting of 207,014,213 people shows a poor negative correlation between the proportion of Iroquois and household income with householder between the ages 25 and 44 in the United States with a correlation coefficient (R) of -0.181 and weighted average of $83,682. Similarly, the statistical analysis conducted on geographies consisting of 339,467,861 people shows a substantial negative correlation between the proportion of Immigrants from Japan and household income with householder between the ages 25 and 44 in the United States with a correlation coefficient (R) of -0.530 and weighted average of $112,228, a difference of 34.1%.
Householder Income Ages 25 - 44 years Correlation Summary
| Measurement | Iroquois | Immigrants from Japan |
| Minimum | $40,878 | $8,816 |
| Maximum | $102,951 | $186,269 |
| Range | $62,073 | $177,453 |
| Mean | $73,208 | $125,080 |
| Median | $76,438 | $123,352 |
| Interquartile 25% (IQ1) | $63,949 | $106,100 |
| Interquartile 75% (IQ3) | $84,029 | $150,805 |
| Interquartile Range (IQR) | $20,079 | $44,706 |
| Standard Deviation (Sample) | $16,006 | $38,741 |
| Standard Deviation (Population) | $15,746 | $38,167 |
Similar Demographics by Householder Income Ages 25 - 44 years
Demographics Similar to Iroquois by Householder Income Ages 25 - 44 years
In terms of householder income ages 25 - 44 years, the demographic groups most similar to Iroquois are Spanish American ($83,722, a difference of 0.050%), Somali ($83,752, a difference of 0.080%), Marshallese ($83,575, a difference of 0.13%), Jamaican ($83,933, a difference of 0.30%), and Immigrants from Jamaica ($83,298, a difference of 0.46%).
| Demographics | Rating | Rank | Householder Income Ages 25 - 44 years |
| Immigrants | Cabo Verde | 0.3 /100 | #266 | Tragic $84,304 |
| Hmong | 0.3 /100 | #267 | Tragic $84,258 |
| Sub-Saharan Africans | 0.3 /100 | #268 | Tragic $84,235 |
| Spanish American Indians | 0.3 /100 | #269 | Tragic $84,085 |
| Jamaicans | 0.3 /100 | #270 | Tragic $83,933 |
| Somalis | 0.2 /100 | #271 | Tragic $83,752 |
| Spanish Americans | 0.2 /100 | #272 | Tragic $83,722 |
| Iroquois | 0.2 /100 | #273 | Tragic $83,682 |
| Marshallese | 0.2 /100 | #274 | Tragic $83,575 |
| Immigrants | Jamaica | 0.2 /100 | #275 | Tragic $83,298 |
| Immigrants | Belize | 0.2 /100 | #276 | Tragic $83,141 |
| Paiute | 0.2 /100 | #277 | Tragic $82,984 |
| Senegalese | 0.2 /100 | #278 | Tragic $82,852 |
| Pima | 0.1 /100 | #279 | Tragic $82,821 |
| Colville | 0.1 /100 | #280 | Tragic $82,604 |
Demographics Similar to Immigrants from Japan by Householder Income Ages 25 - 44 years
In terms of householder income ages 25 - 44 years, the demographic groups most similar to Immigrants from Japan are Immigrants from Sweden ($112,010, a difference of 0.19%), Immigrants from Belgium ($112,575, a difference of 0.31%), Asian ($112,666, a difference of 0.39%), Immigrants from Northern Europe ($111,676, a difference of 0.49%), and Immigrants from Korea ($113,401, a difference of 1.1%).
| Demographics | Rating | Rank | Householder Income Ages 25 - 44 years |
| Cypriots | 100.0 /100 | #16 | Exceptional $116,364 |
| Immigrants | Australia | 100.0 /100 | #17 | Exceptional $115,947 |
| Eastern Europeans | 100.0 /100 | #18 | Exceptional $114,523 |
| Burmese | 100.0 /100 | #19 | Exceptional $113,701 |
| Immigrants | Korea | 100.0 /100 | #20 | Exceptional $113,401 |
| Asians | 100.0 /100 | #21 | Exceptional $112,666 |
| Immigrants | Belgium | 100.0 /100 | #22 | Exceptional $112,575 |
| Immigrants | Japan | 100.0 /100 | #23 | Exceptional $112,228 |
| Immigrants | Sweden | 100.0 /100 | #24 | Exceptional $112,010 |
| Immigrants | Northern Europe | 100.0 /100 | #25 | Exceptional $111,676 |
| Immigrants | Asia | 100.0 /100 | #26 | Exceptional $110,787 |
| Russians | 100.0 /100 | #27 | Exceptional $110,398 |
| Immigrants | Denmark | 100.0 /100 | #28 | Exceptional $110,363 |
| Turks | 100.0 /100 | #29 | Exceptional $110,318 |
| Immigrants | Greece | 100.0 /100 | #30 | Exceptional $110,103 |