Immigrants from Nigeria vs Immigrants from Japan Householder Income Ages 25 - 44 years
COMPARE
Immigrants from Nigeria
Immigrants from Japan
Householder Income Ages 25 - 44 years
Householder Income Ages 25 - 44 years Comparison
Immigrants from Nigeria
Immigrants from Japan
$86,589
HOUSEHOLDER INCOME AGES 25 - 44 YEARS
1.2/ 100
METRIC RATING
247th/ 347
METRIC RANK
$112,228
HOUSEHOLDER INCOME AGES 25 - 44 YEARS
100.0/ 100
METRIC RATING
23rd/ 347
METRIC RANK
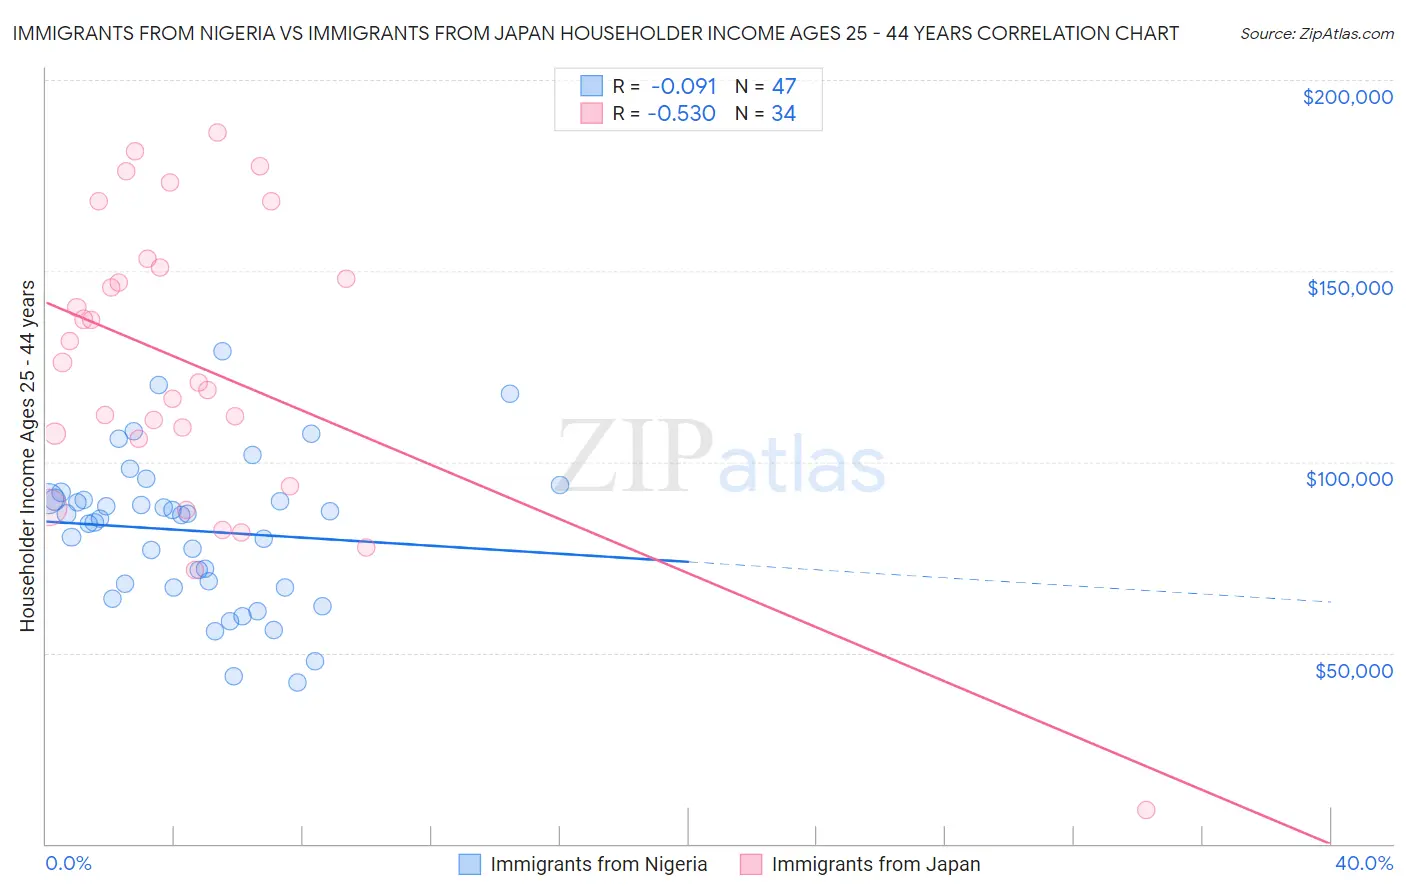
Immigrants from Nigeria vs Immigrants from Japan Householder Income Ages 25 - 44 years Correlation Chart
The statistical analysis conducted on geographies consisting of 283,094,597 people shows a slight negative correlation between the proportion of Immigrants from Nigeria and household income with householder between the ages 25 and 44 in the United States with a correlation coefficient (R) of -0.091 and weighted average of $86,589. Similarly, the statistical analysis conducted on geographies consisting of 339,467,861 people shows a substantial negative correlation between the proportion of Immigrants from Japan and household income with householder between the ages 25 and 44 in the United States with a correlation coefficient (R) of -0.530 and weighted average of $112,228, a difference of 29.6%.
Householder Income Ages 25 - 44 years Correlation Summary
| Measurement | Immigrants from Nigeria | Immigrants from Japan |
| Minimum | $42,092 | $8,816 |
| Maximum | $128,882 | $186,269 |
| Range | $86,790 | $177,453 |
| Mean | $81,924 | $125,080 |
| Median | $86,086 | $123,352 |
| Interquartile 25% (IQ1) | $67,086 | $106,100 |
| Interquartile 75% (IQ3) | $90,392 | $150,805 |
| Interquartile Range (IQR) | $23,305 | $44,706 |
| Standard Deviation (Sample) | $19,417 | $38,741 |
| Standard Deviation (Population) | $19,209 | $38,167 |
Similar Demographics by Householder Income Ages 25 - 44 years
Demographics Similar to Immigrants from Nigeria by Householder Income Ages 25 - 44 years
In terms of householder income ages 25 - 44 years, the demographic groups most similar to Immigrants from Nigeria are Immigrants from Burma/Myanmar ($86,736, a difference of 0.17%), Immigrants from El Salvador ($86,913, a difference of 0.37%), Immigrants from Venezuela ($87,038, a difference of 0.52%), Immigrants from West Indies ($87,063, a difference of 0.55%), and Immigrants from Sudan ($86,109, a difference of 0.56%).
| Demographics | Rating | Rank | Householder Income Ages 25 - 44 years |
| Nicaraguans | 2.2 /100 | #240 | Tragic $87,751 |
| Nigerians | 2.2 /100 | #241 | Tragic $87,730 |
| West Indians | 1.7 /100 | #242 | Tragic $87,205 |
| Immigrants | West Indies | 1.5 /100 | #243 | Tragic $87,063 |
| Immigrants | Venezuela | 1.5 /100 | #244 | Tragic $87,038 |
| Immigrants | El Salvador | 1.4 /100 | #245 | Tragic $86,913 |
| Immigrants | Burma/Myanmar | 1.3 /100 | #246 | Tragic $86,736 |
| Immigrants | Nigeria | 1.2 /100 | #247 | Tragic $86,589 |
| Immigrants | Sudan | 0.9 /100 | #248 | Tragic $86,109 |
| French American Indians | 0.8 /100 | #249 | Tragic $85,899 |
| Pennsylvania Germans | 0.8 /100 | #250 | Tragic $85,836 |
| Cape Verdeans | 0.8 /100 | #251 | Tragic $85,758 |
| Immigrants | Western Africa | 0.7 /100 | #252 | Tragic $85,676 |
| British West Indians | 0.7 /100 | #253 | Tragic $85,565 |
| Immigrants | Laos | 0.7 /100 | #254 | Tragic $85,553 |
Demographics Similar to Immigrants from Japan by Householder Income Ages 25 - 44 years
In terms of householder income ages 25 - 44 years, the demographic groups most similar to Immigrants from Japan are Immigrants from Sweden ($112,010, a difference of 0.19%), Immigrants from Belgium ($112,575, a difference of 0.31%), Asian ($112,666, a difference of 0.39%), Immigrants from Northern Europe ($111,676, a difference of 0.49%), and Immigrants from Korea ($113,401, a difference of 1.1%).
| Demographics | Rating | Rank | Householder Income Ages 25 - 44 years |
| Cypriots | 100.0 /100 | #16 | Exceptional $116,364 |
| Immigrants | Australia | 100.0 /100 | #17 | Exceptional $115,947 |
| Eastern Europeans | 100.0 /100 | #18 | Exceptional $114,523 |
| Burmese | 100.0 /100 | #19 | Exceptional $113,701 |
| Immigrants | Korea | 100.0 /100 | #20 | Exceptional $113,401 |
| Asians | 100.0 /100 | #21 | Exceptional $112,666 |
| Immigrants | Belgium | 100.0 /100 | #22 | Exceptional $112,575 |
| Immigrants | Japan | 100.0 /100 | #23 | Exceptional $112,228 |
| Immigrants | Sweden | 100.0 /100 | #24 | Exceptional $112,010 |
| Immigrants | Northern Europe | 100.0 /100 | #25 | Exceptional $111,676 |
| Immigrants | Asia | 100.0 /100 | #26 | Exceptional $110,787 |
| Russians | 100.0 /100 | #27 | Exceptional $110,398 |
| Immigrants | Denmark | 100.0 /100 | #28 | Exceptional $110,363 |
| Turks | 100.0 /100 | #29 | Exceptional $110,318 |
| Immigrants | Greece | 100.0 /100 | #30 | Exceptional $110,103 |