Immigrants from Sweden vs Immigrants from Taiwan Median Earnings
COMPARE
Immigrants from Sweden
Immigrants from Taiwan
Median Earnings
Median Earnings Comparison
Immigrants from Sweden
Immigrants from Taiwan
$54,478
MEDIAN EARNINGS
100.0/ 100
METRIC RATING
23rd/ 347
METRIC RANK
$61,151
MEDIAN EARNINGS
100.0/ 100
METRIC RATING
2nd/ 347
METRIC RANK
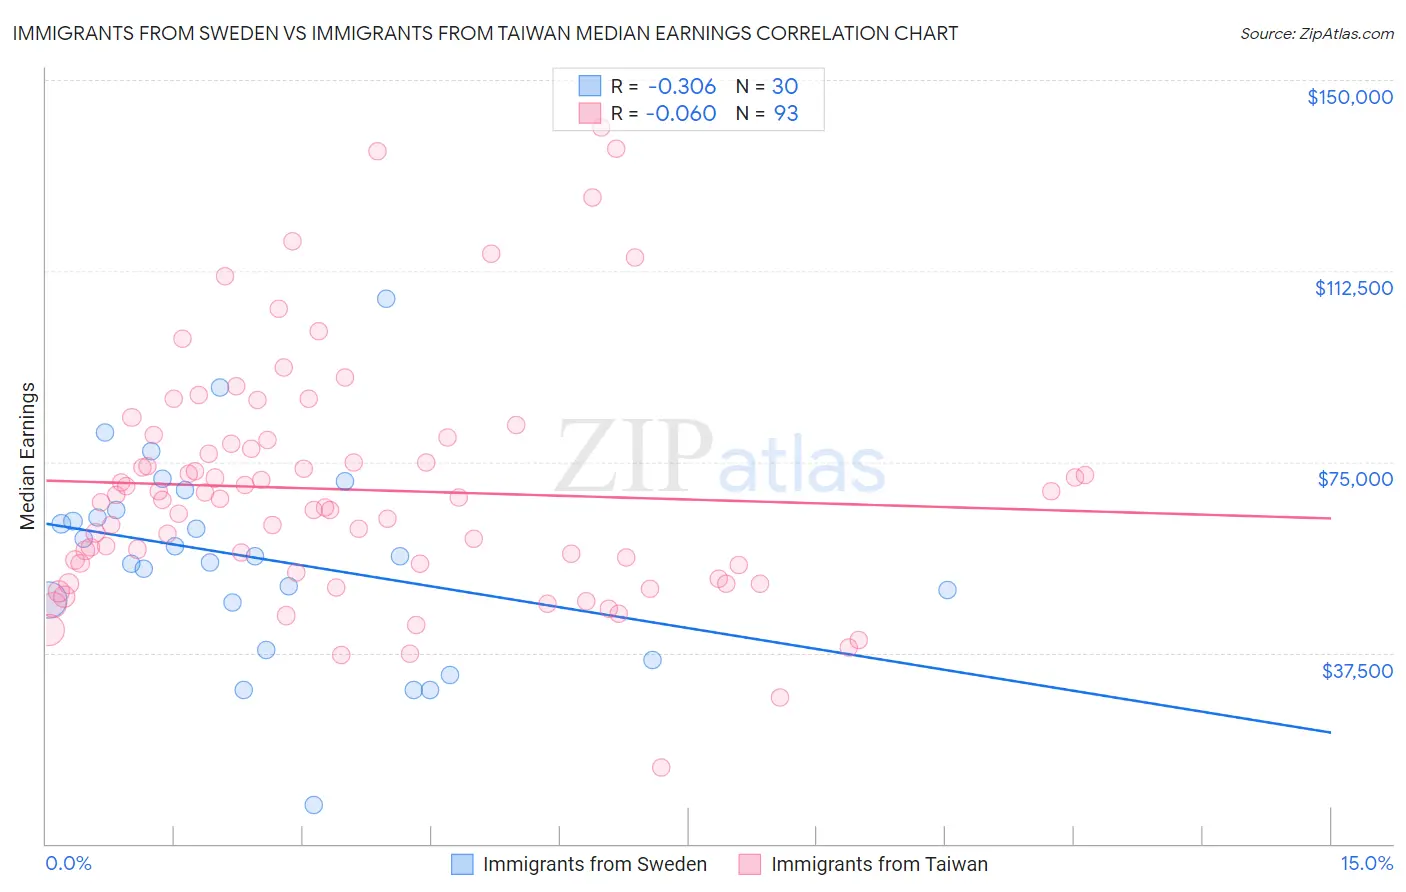
Immigrants from Sweden vs Immigrants from Taiwan Median Earnings Correlation Chart
The statistical analysis conducted on geographies consisting of 164,745,494 people shows a mild negative correlation between the proportion of Immigrants from Sweden and median earnings in the United States with a correlation coefficient (R) of -0.306 and weighted average of $54,478. Similarly, the statistical analysis conducted on geographies consisting of 298,281,567 people shows a slight negative correlation between the proportion of Immigrants from Taiwan and median earnings in the United States with a correlation coefficient (R) of -0.060 and weighted average of $61,151, a difference of 12.2%.
Median Earnings Correlation Summary
| Measurement | Immigrants from Sweden | Immigrants from Taiwan |
| Minimum | $7,643 | $15,000 |
| Maximum | $106,979 | $140,742 |
| Range | $99,336 | $125,742 |
| Mean | $56,044 | $69,540 |
| Median | $56,394 | $67,496 |
| Interquartile 25% (IQ1) | $47,341 | $54,032 |
| Interquartile 75% (IQ3) | $65,578 | $78,915 |
| Interquartile Range (IQR) | $18,237 | $24,883 |
| Standard Deviation (Sample) | $19,951 | $23,624 |
| Standard Deviation (Population) | $19,616 | $23,497 |
Similar Demographics by Median Earnings
Demographics Similar to Immigrants from Sweden by Median Earnings
In terms of median earnings, the demographic groups most similar to Immigrants from Sweden are Immigrants from Korea ($54,530, a difference of 0.10%), Burmese ($54,559, a difference of 0.15%), Cypriot ($54,589, a difference of 0.20%), Soviet Union ($54,290, a difference of 0.35%), and Immigrants from Belgium ($54,679, a difference of 0.37%).
| Demographics | Rating | Rank | Median Earnings |
| Immigrants | Eastern Asia | 100.0 /100 | #16 | Exceptional $56,183 |
| Eastern Europeans | 100.0 /100 | #17 | Exceptional $55,084 |
| Immigrants | Japan | 100.0 /100 | #18 | Exceptional $54,938 |
| Immigrants | Belgium | 100.0 /100 | #19 | Exceptional $54,679 |
| Cypriots | 100.0 /100 | #20 | Exceptional $54,589 |
| Burmese | 100.0 /100 | #21 | Exceptional $54,559 |
| Immigrants | Korea | 100.0 /100 | #22 | Exceptional $54,530 |
| Immigrants | Sweden | 100.0 /100 | #23 | Exceptional $54,478 |
| Soviet Union | 100.0 /100 | #24 | Exceptional $54,290 |
| Turks | 100.0 /100 | #25 | Exceptional $53,919 |
| Immigrants | Northern Europe | 100.0 /100 | #26 | Exceptional $53,872 |
| Asians | 100.0 /100 | #27 | Exceptional $53,690 |
| Immigrants | France | 100.0 /100 | #28 | Exceptional $53,490 |
| Immigrants | Russia | 100.0 /100 | #29 | Exceptional $53,457 |
| Cambodians | 100.0 /100 | #30 | Exceptional $53,386 |
Demographics Similar to Immigrants from Taiwan by Median Earnings
In terms of median earnings, the demographic groups most similar to Immigrants from Taiwan are Filipino ($61,197, a difference of 0.080%), Immigrants from India ($60,648, a difference of 0.83%), Immigrants from Hong Kong ($59,433, a difference of 2.9%), Thai ($59,237, a difference of 3.2%), and Immigrants from Singapore ($59,038, a difference of 3.6%).
| Demographics | Rating | Rank | Median Earnings |
| Filipinos | 100.0 /100 | #1 | Exceptional $61,197 |
| Immigrants | Taiwan | 100.0 /100 | #2 | Exceptional $61,151 |
| Immigrants | India | 100.0 /100 | #3 | Exceptional $60,648 |
| Immigrants | Hong Kong | 100.0 /100 | #4 | Exceptional $59,433 |
| Thais | 100.0 /100 | #5 | Exceptional $59,237 |
| Immigrants | Singapore | 100.0 /100 | #6 | Exceptional $59,038 |
| Iranians | 100.0 /100 | #7 | Exceptional $58,474 |
| Immigrants | Iran | 100.0 /100 | #8 | Exceptional $57,612 |
| Okinawans | 100.0 /100 | #9 | Exceptional $57,550 |
| Immigrants | South Central Asia | 100.0 /100 | #10 | Exceptional $57,114 |
| Immigrants | Israel | 100.0 /100 | #11 | Exceptional $57,034 |
| Immigrants | Ireland | 100.0 /100 | #12 | Exceptional $56,854 |
| Immigrants | China | 100.0 /100 | #13 | Exceptional $56,638 |
| Immigrants | Australia | 100.0 /100 | #14 | Exceptional $56,305 |
| Indians (Asian) | 100.0 /100 | #15 | Exceptional $56,253 |