Immigrants from Sweden vs Immigrants from Armenia Median Earnings
COMPARE
Immigrants from Sweden
Immigrants from Armenia
Median Earnings
Median Earnings Comparison
Immigrants from Sweden
Immigrants from Armenia
$54,478
MEDIAN EARNINGS
100.0/ 100
METRIC RATING
23rd/ 347
METRIC RANK
$46,094
MEDIAN EARNINGS
38.3/ 100
METRIC RATING
188th/ 347
METRIC RANK
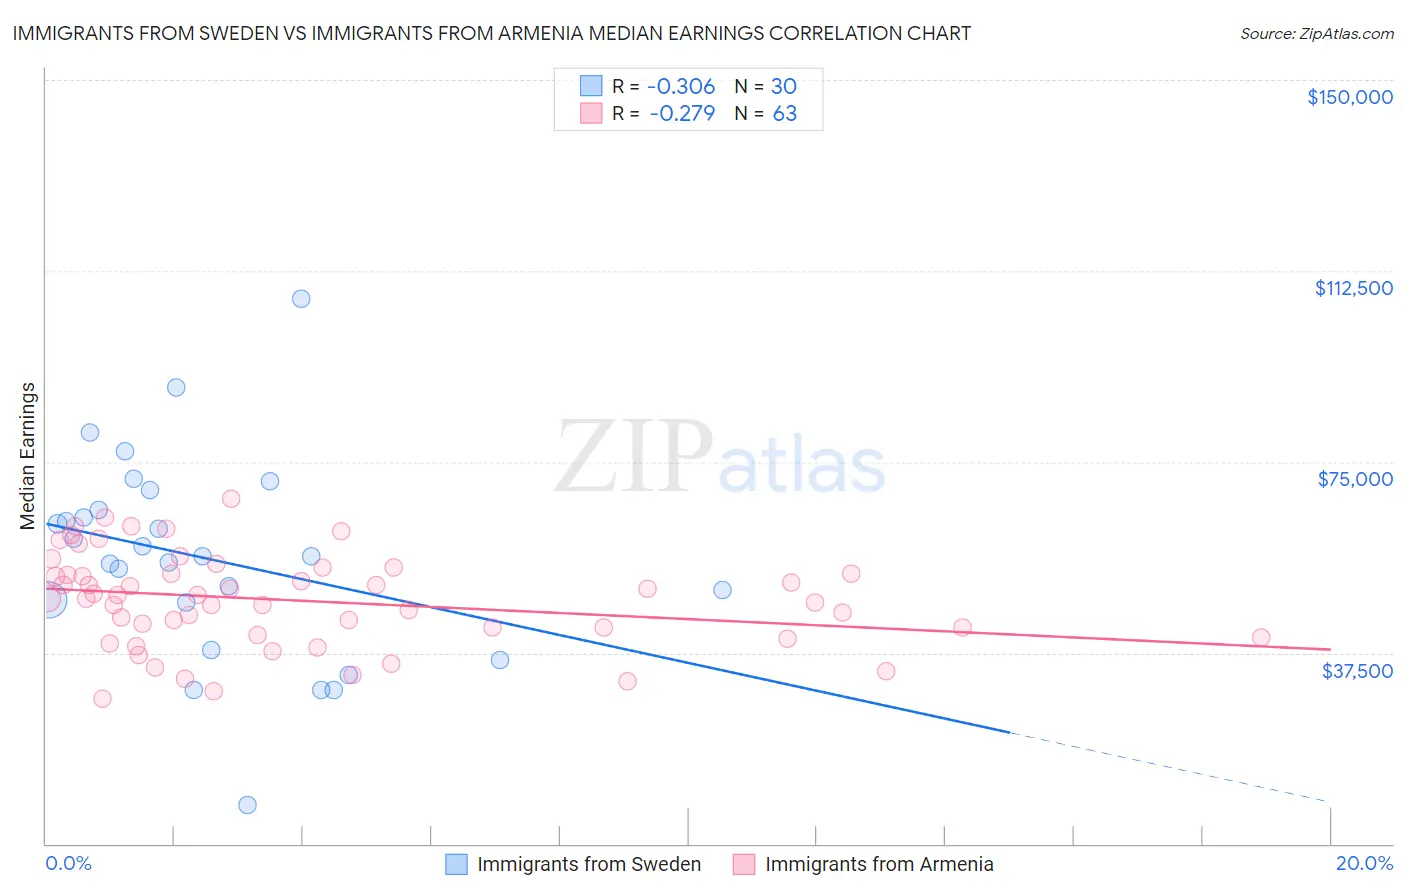
Immigrants from Sweden vs Immigrants from Armenia Median Earnings Correlation Chart
The statistical analysis conducted on geographies consisting of 164,745,494 people shows a mild negative correlation between the proportion of Immigrants from Sweden and median earnings in the United States with a correlation coefficient (R) of -0.306 and weighted average of $54,478. Similarly, the statistical analysis conducted on geographies consisting of 97,724,966 people shows a weak negative correlation between the proportion of Immigrants from Armenia and median earnings in the United States with a correlation coefficient (R) of -0.279 and weighted average of $46,094, a difference of 18.2%.
Median Earnings Correlation Summary
| Measurement | Immigrants from Sweden | Immigrants from Armenia |
| Minimum | $7,643 | $28,479 |
| Maximum | $106,979 | $67,833 |
| Range | $99,336 | $39,354 |
| Mean | $56,044 | $47,758 |
| Median | $56,394 | $48,131 |
| Interquartile 25% (IQ1) | $47,341 | $40,972 |
| Interquartile 75% (IQ3) | $65,578 | $53,018 |
| Interquartile Range (IQR) | $18,237 | $12,046 |
| Standard Deviation (Sample) | $19,951 | $9,191 |
| Standard Deviation (Population) | $19,616 | $9,118 |
Similar Demographics by Median Earnings
Demographics Similar to Immigrants from Sweden by Median Earnings
In terms of median earnings, the demographic groups most similar to Immigrants from Sweden are Immigrants from Korea ($54,530, a difference of 0.10%), Burmese ($54,559, a difference of 0.15%), Cypriot ($54,589, a difference of 0.20%), Soviet Union ($54,290, a difference of 0.35%), and Immigrants from Belgium ($54,679, a difference of 0.37%).
| Demographics | Rating | Rank | Median Earnings |
| Immigrants | Eastern Asia | 100.0 /100 | #16 | Exceptional $56,183 |
| Eastern Europeans | 100.0 /100 | #17 | Exceptional $55,084 |
| Immigrants | Japan | 100.0 /100 | #18 | Exceptional $54,938 |
| Immigrants | Belgium | 100.0 /100 | #19 | Exceptional $54,679 |
| Cypriots | 100.0 /100 | #20 | Exceptional $54,589 |
| Burmese | 100.0 /100 | #21 | Exceptional $54,559 |
| Immigrants | Korea | 100.0 /100 | #22 | Exceptional $54,530 |
| Immigrants | Sweden | 100.0 /100 | #23 | Exceptional $54,478 |
| Soviet Union | 100.0 /100 | #24 | Exceptional $54,290 |
| Turks | 100.0 /100 | #25 | Exceptional $53,919 |
| Immigrants | Northern Europe | 100.0 /100 | #26 | Exceptional $53,872 |
| Asians | 100.0 /100 | #27 | Exceptional $53,690 |
| Immigrants | France | 100.0 /100 | #28 | Exceptional $53,490 |
| Immigrants | Russia | 100.0 /100 | #29 | Exceptional $53,457 |
| Cambodians | 100.0 /100 | #30 | Exceptional $53,386 |
Demographics Similar to Immigrants from Armenia by Median Earnings
In terms of median earnings, the demographic groups most similar to Immigrants from Armenia are Spaniard ($46,059, a difference of 0.080%), Iraqi ($46,140, a difference of 0.10%), French Canadian ($46,026, a difference of 0.15%), Vietnamese ($46,172, a difference of 0.17%), and Uruguayan ($46,190, a difference of 0.21%).
| Demographics | Rating | Rank | Median Earnings |
| Immigrants | Cameroon | 46.4 /100 | #181 | Average $46,329 |
| Swiss | 45.9 /100 | #182 | Average $46,315 |
| French | 45.2 /100 | #183 | Average $46,296 |
| Immigrants | Kenya | 42.4 /100 | #184 | Average $46,214 |
| Uruguayans | 41.6 /100 | #185 | Average $46,190 |
| Vietnamese | 40.9 /100 | #186 | Average $46,172 |
| Iraqis | 39.9 /100 | #187 | Fair $46,140 |
| Immigrants | Armenia | 38.3 /100 | #188 | Fair $46,094 |
| Spaniards | 37.2 /100 | #189 | Fair $46,059 |
| French Canadians | 36.1 /100 | #190 | Fair $46,026 |
| Finns | 33.4 /100 | #191 | Fair $45,940 |
| Germans | 33.2 /100 | #192 | Fair $45,935 |
| Guamanians/Chamorros | 33.2 /100 | #193 | Fair $45,933 |
| Immigrants | Costa Rica | 33.0 /100 | #194 | Fair $45,928 |
| Immigrants | St. Vincent and the Grenadines | 32.4 /100 | #195 | Fair $45,908 |