Immigrants from Sierra Leone vs Macedonian Median Earnings
COMPARE
Immigrants from Sierra Leone
Macedonian
Median Earnings
Median Earnings Comparison
Immigrants from Sierra Leone
Macedonians
$47,875
MEDIAN EARNINGS
88.3/ 100
METRIC RATING
141st/ 347
METRIC RANK
$49,893
MEDIAN EARNINGS
99.2/ 100
METRIC RATING
91st/ 347
METRIC RANK
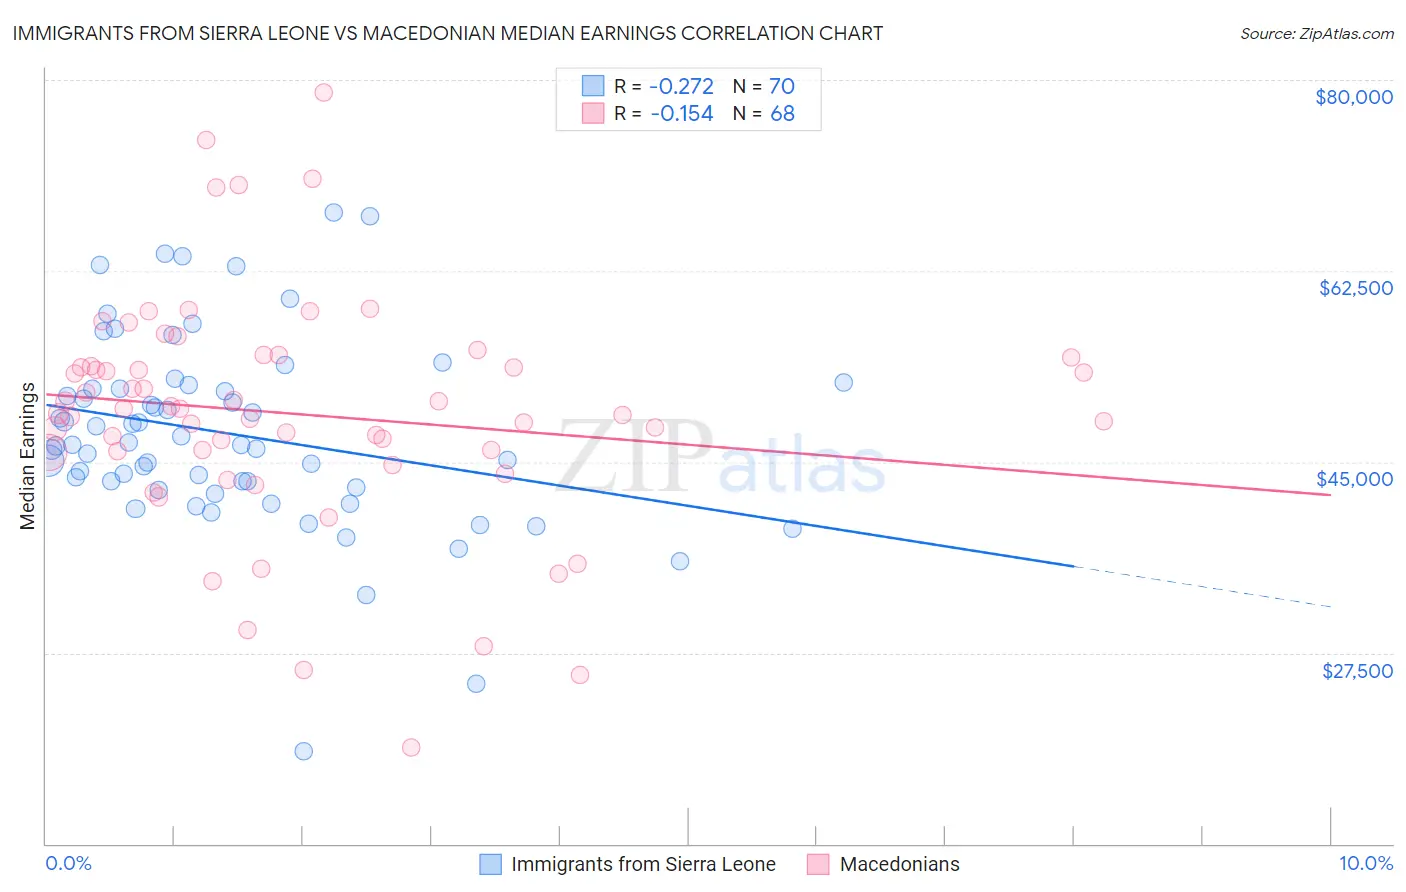
Immigrants from Sierra Leone vs Macedonian Median Earnings Correlation Chart
The statistical analysis conducted on geographies consisting of 101,648,548 people shows a weak negative correlation between the proportion of Immigrants from Sierra Leone and median earnings in the United States with a correlation coefficient (R) of -0.272 and weighted average of $47,875. Similarly, the statistical analysis conducted on geographies consisting of 132,586,624 people shows a poor negative correlation between the proportion of Macedonians and median earnings in the United States with a correlation coefficient (R) of -0.154 and weighted average of $49,893, a difference of 4.2%.
Median Earnings Correlation Summary
| Measurement | Immigrants from Sierra Leone | Macedonian |
| Minimum | $18,466 | $18,816 |
| Maximum | $67,883 | $78,907 |
| Range | $49,417 | $60,091 |
| Mean | $47,536 | $49,392 |
| Median | $46,582 | $49,655 |
| Interquartile 25% (IQ1) | $42,603 | $45,965 |
| Interquartile 75% (IQ3) | $51,717 | $54,145 |
| Interquartile Range (IQR) | $9,114 | $8,180 |
| Standard Deviation (Sample) | $8,851 | $10,833 |
| Standard Deviation (Population) | $8,787 | $10,753 |
Similar Demographics by Median Earnings
Demographics Similar to Immigrants from Sierra Leone by Median Earnings
In terms of median earnings, the demographic groups most similar to Immigrants from Sierra Leone are Ugandan ($47,854, a difference of 0.040%), Swedish ($47,851, a difference of 0.050%), Taiwanese ($47,902, a difference of 0.060%), European ($47,915, a difference of 0.080%), and Canadian ($47,911, a difference of 0.080%).
| Demographics | Rating | Rank | Median Earnings |
| Sri Lankans | 90.5 /100 | #134 | Exceptional $48,040 |
| Portuguese | 90.4 /100 | #135 | Exceptional $48,032 |
| Slovenes | 90.0 /100 | #136 | Excellent $47,995 |
| Immigrants | Nepal | 89.0 /100 | #137 | Excellent $47,925 |
| Europeans | 88.9 /100 | #138 | Excellent $47,915 |
| Canadians | 88.8 /100 | #139 | Excellent $47,911 |
| Taiwanese | 88.7 /100 | #140 | Excellent $47,902 |
| Immigrants | Sierra Leone | 88.3 /100 | #141 | Excellent $47,875 |
| Ugandans | 88.0 /100 | #142 | Excellent $47,854 |
| Swedes | 88.0 /100 | #143 | Excellent $47,851 |
| Hungarians | 87.1 /100 | #144 | Excellent $47,795 |
| Immigrants | Saudi Arabia | 85.6 /100 | #145 | Excellent $47,704 |
| Immigrants | Chile | 85.5 /100 | #146 | Excellent $47,697 |
| Immigrants | South Eastern Asia | 85.0 /100 | #147 | Excellent $47,671 |
| Immigrants | Eritrea | 84.8 /100 | #148 | Excellent $47,657 |
Demographics Similar to Macedonians by Median Earnings
In terms of median earnings, the demographic groups most similar to Macedonians are Italian ($49,915, a difference of 0.040%), Immigrants from Argentina ($49,841, a difference of 0.11%), Armenian ($49,804, a difference of 0.18%), Croatian ($49,724, a difference of 0.34%), and Immigrants from England ($49,722, a difference of 0.34%).
| Demographics | Rating | Rank | Median Earnings |
| Immigrants | Hungary | 99.5 /100 | #84 | Exceptional $50,227 |
| Immigrants | Kazakhstan | 99.5 /100 | #85 | Exceptional $50,225 |
| Immigrants | Canada | 99.5 /100 | #86 | Exceptional $50,192 |
| Immigrants | Uzbekistan | 99.5 /100 | #87 | Exceptional $50,151 |
| Albanians | 99.4 /100 | #88 | Exceptional $50,116 |
| Immigrants | North America | 99.4 /100 | #89 | Exceptional $50,108 |
| Italians | 99.3 /100 | #90 | Exceptional $49,915 |
| Macedonians | 99.2 /100 | #91 | Exceptional $49,893 |
| Immigrants | Argentina | 99.2 /100 | #92 | Exceptional $49,841 |
| Armenians | 99.1 /100 | #93 | Exceptional $49,804 |
| Croatians | 99.0 /100 | #94 | Exceptional $49,724 |
| Immigrants | England | 99.0 /100 | #95 | Exceptional $49,722 |
| Immigrants | Lebanon | 99.0 /100 | #96 | Exceptional $49,682 |
| Immigrants | North Macedonia | 98.9 /100 | #97 | Exceptional $49,658 |
| Immigrants | Northern Africa | 98.9 /100 | #98 | Exceptional $49,648 |