Immigrants from Sierra Leone vs Ethiopian Median Earnings
COMPARE
Immigrants from Sierra Leone
Ethiopian
Median Earnings
Median Earnings Comparison
Immigrants from Sierra Leone
Ethiopians
$47,875
MEDIAN EARNINGS
88.3/ 100
METRIC RATING
141st/ 347
METRIC RANK
$49,572
MEDIAN EARNINGS
98.8/ 100
METRIC RATING
102nd/ 347
METRIC RANK
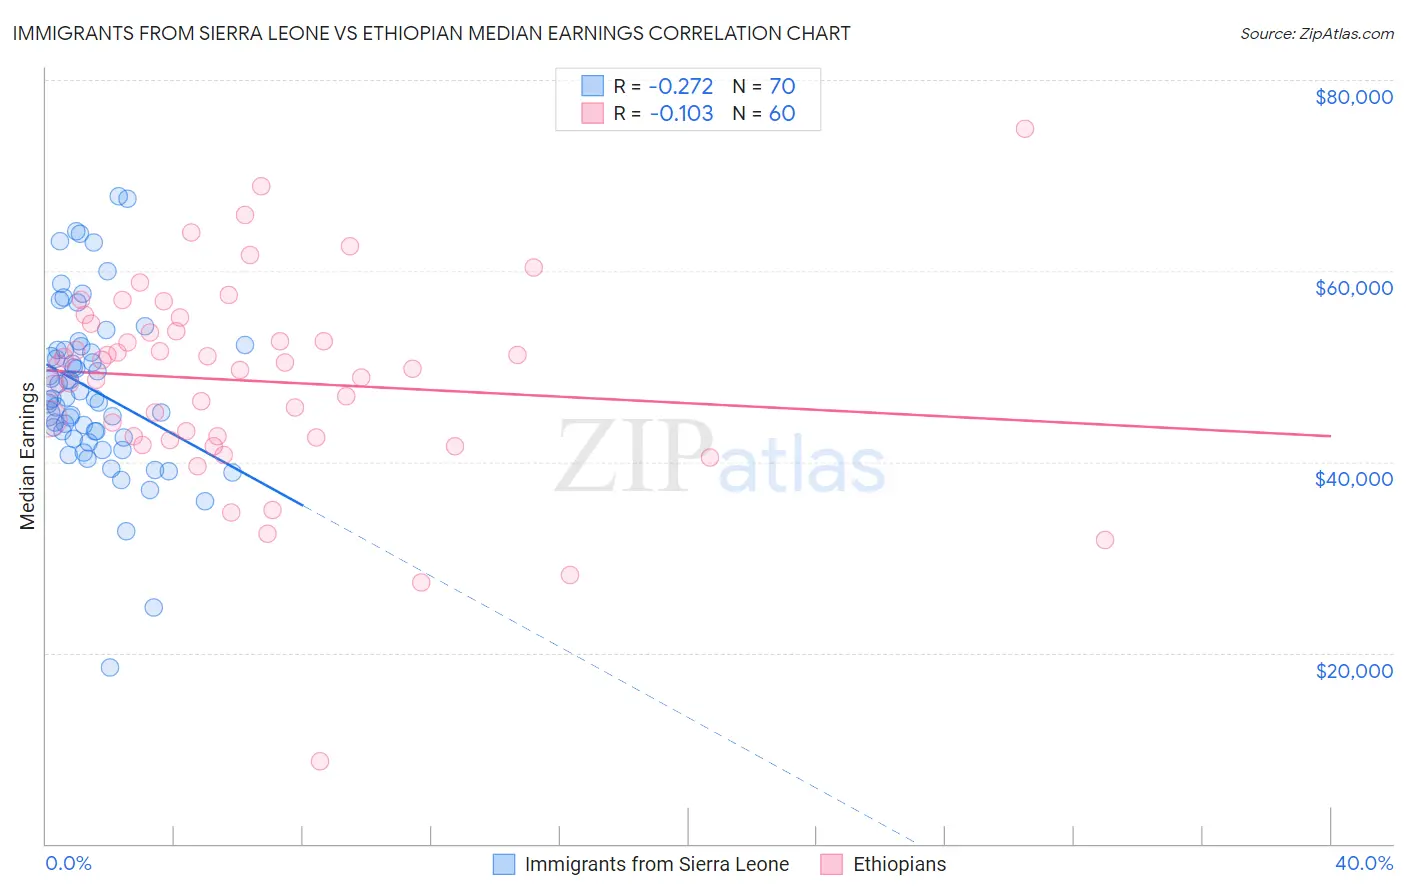
Immigrants from Sierra Leone vs Ethiopian Median Earnings Correlation Chart
The statistical analysis conducted on geographies consisting of 101,648,548 people shows a weak negative correlation between the proportion of Immigrants from Sierra Leone and median earnings in the United States with a correlation coefficient (R) of -0.272 and weighted average of $47,875. Similarly, the statistical analysis conducted on geographies consisting of 223,260,849 people shows a poor negative correlation between the proportion of Ethiopians and median earnings in the United States with a correlation coefficient (R) of -0.103 and weighted average of $49,572, a difference of 3.5%.
Median Earnings Correlation Summary
| Measurement | Immigrants from Sierra Leone | Ethiopian |
| Minimum | $18,466 | $8,623 |
| Maximum | $67,883 | $74,844 |
| Range | $49,417 | $66,221 |
| Mean | $47,536 | $48,479 |
| Median | $46,582 | $49,984 |
| Interquartile 25% (IQ1) | $42,603 | $42,620 |
| Interquartile 75% (IQ3) | $51,717 | $54,089 |
| Interquartile Range (IQR) | $9,114 | $11,470 |
| Standard Deviation (Sample) | $8,851 | $10,733 |
| Standard Deviation (Population) | $8,787 | $10,643 |
Similar Demographics by Median Earnings
Demographics Similar to Immigrants from Sierra Leone by Median Earnings
In terms of median earnings, the demographic groups most similar to Immigrants from Sierra Leone are Ugandan ($47,854, a difference of 0.040%), Swedish ($47,851, a difference of 0.050%), Taiwanese ($47,902, a difference of 0.060%), European ($47,915, a difference of 0.080%), and Canadian ($47,911, a difference of 0.080%).
| Demographics | Rating | Rank | Median Earnings |
| Sri Lankans | 90.5 /100 | #134 | Exceptional $48,040 |
| Portuguese | 90.4 /100 | #135 | Exceptional $48,032 |
| Slovenes | 90.0 /100 | #136 | Excellent $47,995 |
| Immigrants | Nepal | 89.0 /100 | #137 | Excellent $47,925 |
| Europeans | 88.9 /100 | #138 | Excellent $47,915 |
| Canadians | 88.8 /100 | #139 | Excellent $47,911 |
| Taiwanese | 88.7 /100 | #140 | Excellent $47,902 |
| Immigrants | Sierra Leone | 88.3 /100 | #141 | Excellent $47,875 |
| Ugandans | 88.0 /100 | #142 | Excellent $47,854 |
| Swedes | 88.0 /100 | #143 | Excellent $47,851 |
| Hungarians | 87.1 /100 | #144 | Excellent $47,795 |
| Immigrants | Saudi Arabia | 85.6 /100 | #145 | Excellent $47,704 |
| Immigrants | Chile | 85.5 /100 | #146 | Excellent $47,697 |
| Immigrants | South Eastern Asia | 85.0 /100 | #147 | Excellent $47,671 |
| Immigrants | Eritrea | 84.8 /100 | #148 | Excellent $47,657 |
Demographics Similar to Ethiopians by Median Earnings
In terms of median earnings, the demographic groups most similar to Ethiopians are Immigrants from Poland ($49,633, a difference of 0.12%), Jordanian ($49,632, a difference of 0.12%), Austrian ($49,501, a difference of 0.14%), Immigrants from Northern Africa ($49,648, a difference of 0.15%), and Immigrants from Afghanistan ($49,645, a difference of 0.15%).
| Demographics | Rating | Rank | Median Earnings |
| Immigrants | England | 99.0 /100 | #95 | Exceptional $49,722 |
| Immigrants | Lebanon | 99.0 /100 | #96 | Exceptional $49,682 |
| Immigrants | North Macedonia | 98.9 /100 | #97 | Exceptional $49,658 |
| Immigrants | Northern Africa | 98.9 /100 | #98 | Exceptional $49,648 |
| Immigrants | Afghanistan | 98.9 /100 | #99 | Exceptional $49,645 |
| Immigrants | Poland | 98.9 /100 | #100 | Exceptional $49,633 |
| Jordanians | 98.9 /100 | #101 | Exceptional $49,632 |
| Ethiopians | 98.8 /100 | #102 | Exceptional $49,572 |
| Austrians | 98.7 /100 | #103 | Exceptional $49,501 |
| Immigrants | Brazil | 98.6 /100 | #104 | Exceptional $49,463 |
| Immigrants | Western Asia | 98.4 /100 | #105 | Exceptional $49,389 |
| Immigrants | Albania | 98.4 /100 | #106 | Exceptional $49,377 |
| Immigrants | Morocco | 98.4 /100 | #107 | Exceptional $49,368 |
| Palestinians | 98.0 /100 | #108 | Exceptional $49,209 |
| Syrians | 97.1 /100 | #109 | Exceptional $48,934 |