Immigrants from Serbia vs Immigrants from Moldova Wage/Income Gap
COMPARE
Immigrants from Serbia
Immigrants from Moldova
Wage/Income Gap
Wage/Income Gap Comparison
Immigrants from Serbia
Immigrants from Moldova
26.0%
WAGE/INCOME GAP
35.4/ 100
METRIC RATING
182nd/ 347
METRIC RANK
26.2%
WAGE/INCOME GAP
26.6/ 100
METRIC RATING
189th/ 347
METRIC RANK
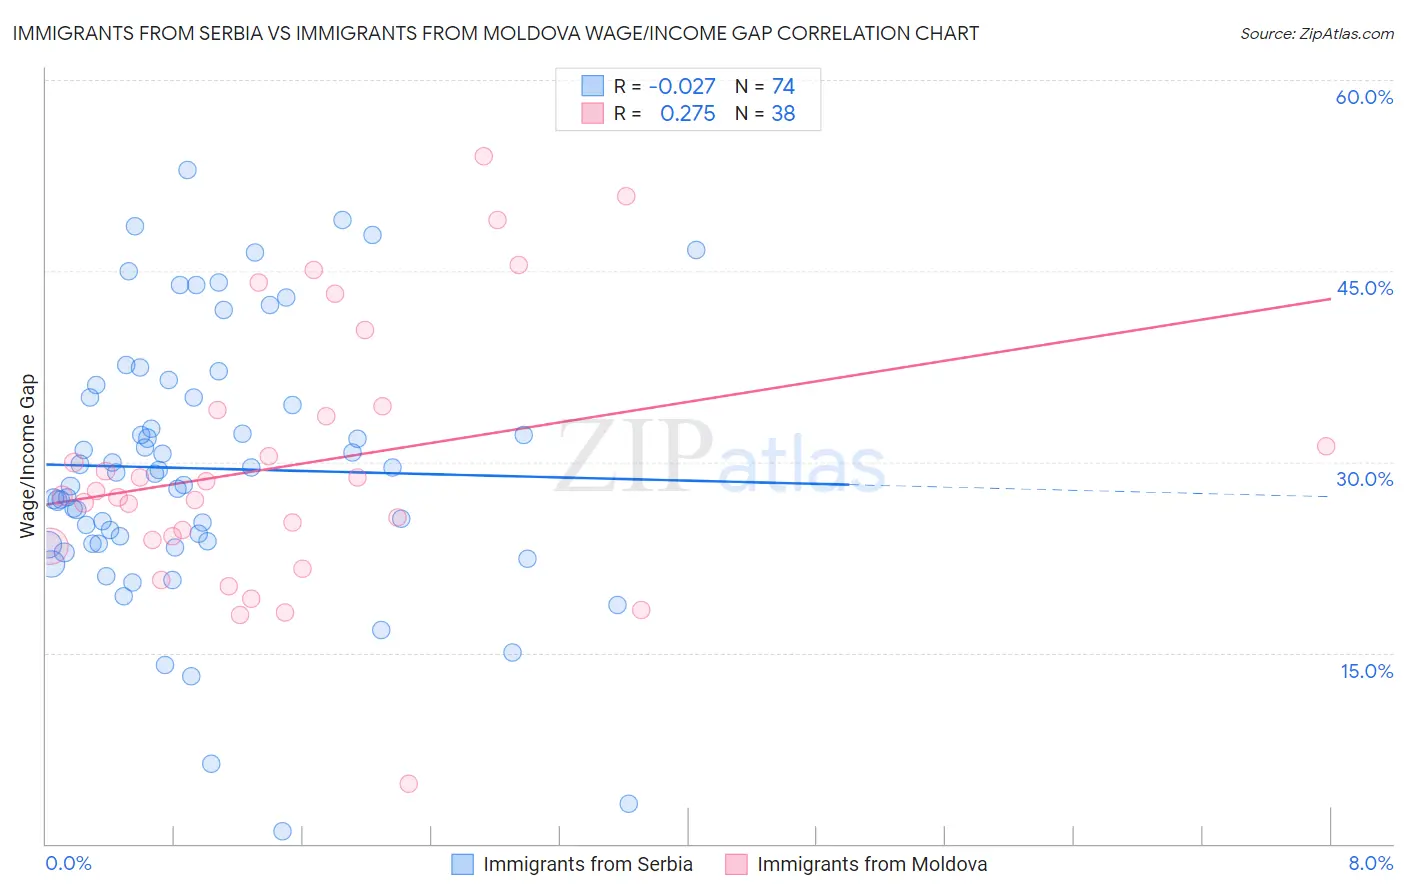
Immigrants from Serbia vs Immigrants from Moldova Wage/Income Gap Correlation Chart
The statistical analysis conducted on geographies consisting of 131,718,439 people shows no correlation between the proportion of Immigrants from Serbia and wage/income gap percentage in the United States with a correlation coefficient (R) of -0.027 and weighted average of 26.0%. Similarly, the statistical analysis conducted on geographies consisting of 124,386,174 people shows a weak positive correlation between the proportion of Immigrants from Moldova and wage/income gap percentage in the United States with a correlation coefficient (R) of 0.275 and weighted average of 26.2%, a difference of 0.66%.
Wage/Income Gap Correlation Summary
| Measurement | Immigrants from Serbia | Immigrants from Moldova |
| Minimum | 0.97% | 4.7% |
| Maximum | 52.9% | 54.0% |
| Range | 51.9% | 49.3% |
| Mean | 29.5% | 29.8% |
| Median | 29.1% | 27.5% |
| Interquartile 25% (IQ1) | 23.6% | 23.8% |
| Interquartile 75% (IQ3) | 35.1% | 34.0% |
| Interquartile Range (IQR) | 11.5% | 10.2% |
| Standard Deviation (Sample) | 10.4% | 10.4% |
| Standard Deviation (Population) | 10.3% | 10.3% |
Demographics Similar to Immigrants from Serbia and Immigrants from Moldova by Wage/Income Gap
In terms of wage/income gap, the demographic groups most similar to Immigrants from Serbia are Immigrants from Kazakhstan (26.0%, a difference of 0.010%), Immigrants from Bolivia (26.0%, a difference of 0.070%), Mexican (26.0%, a difference of 0.070%), Pakistani (26.1%, a difference of 0.12%), and Guamanian/Chamorro (26.0%, a difference of 0.19%). Similarly, the demographic groups most similar to Immigrants from Moldova are Immigrants from Croatia (26.2%, a difference of 0.15%), Immigrants from Venezuela (26.2%, a difference of 0.17%), Palestinian (26.1%, a difference of 0.26%), Immigrants from Egypt (26.1%, a difference of 0.26%), and Immigrants from Bulgaria (26.3%, a difference of 0.35%).
| Demographics | Rating | Rank | Wage/Income Gap |
| Sri Lankans | 47.0 /100 | #175 | Average 25.8% |
| Paraguayans | 46.7 /100 | #176 | Average 25.8% |
| Cambodians | 45.1 /100 | #177 | Average 25.8% |
| Chinese | 42.0 /100 | #178 | Average 25.9% |
| Samoans | 38.6 /100 | #179 | Fair 26.0% |
| Guamanians/Chamorros | 38.0 /100 | #180 | Fair 26.0% |
| Immigrants | Bolivia | 36.4 /100 | #181 | Fair 26.0% |
| Immigrants | Serbia | 35.4 /100 | #182 | Fair 26.0% |
| Immigrants | Kazakhstan | 35.2 /100 | #183 | Fair 26.0% |
| Mexicans | 34.4 /100 | #184 | Fair 26.0% |
| Pakistanis | 33.7 /100 | #185 | Fair 26.1% |
| Immigrants | Indonesia | 32.5 /100 | #186 | Fair 26.1% |
| Palestinians | 29.9 /100 | #187 | Fair 26.1% |
| Immigrants | Egypt | 29.9 /100 | #188 | Fair 26.1% |
| Immigrants | Moldova | 26.6 /100 | #189 | Fair 26.2% |
| Immigrants | Croatia | 24.8 /100 | #190 | Fair 26.2% |
| Immigrants | Venezuela | 24.7 /100 | #191 | Fair 26.2% |
| Immigrants | Bulgaria | 22.5 /100 | #192 | Fair 26.3% |
| Immigrants | Jordan | 22.4 /100 | #193 | Fair 26.3% |
| Chileans | 22.3 /100 | #194 | Fair 26.3% |
| Immigrants | Malaysia | 22.2 /100 | #195 | Fair 26.3% |