Immigrants from Portugal vs White/Caucasian Median Household Income
COMPARE
Immigrants from Portugal
White/Caucasian
Median Household Income
Median Household Income Comparison
Immigrants from Portugal
Whites/Caucasians
$84,740
MEDIAN HOUSEHOLD INCOME
44.2/ 100
METRIC RATING
180th/ 347
METRIC RANK
$82,029
MEDIAN HOUSEHOLD INCOME
12.2/ 100
METRIC RATING
218th/ 347
METRIC RANK
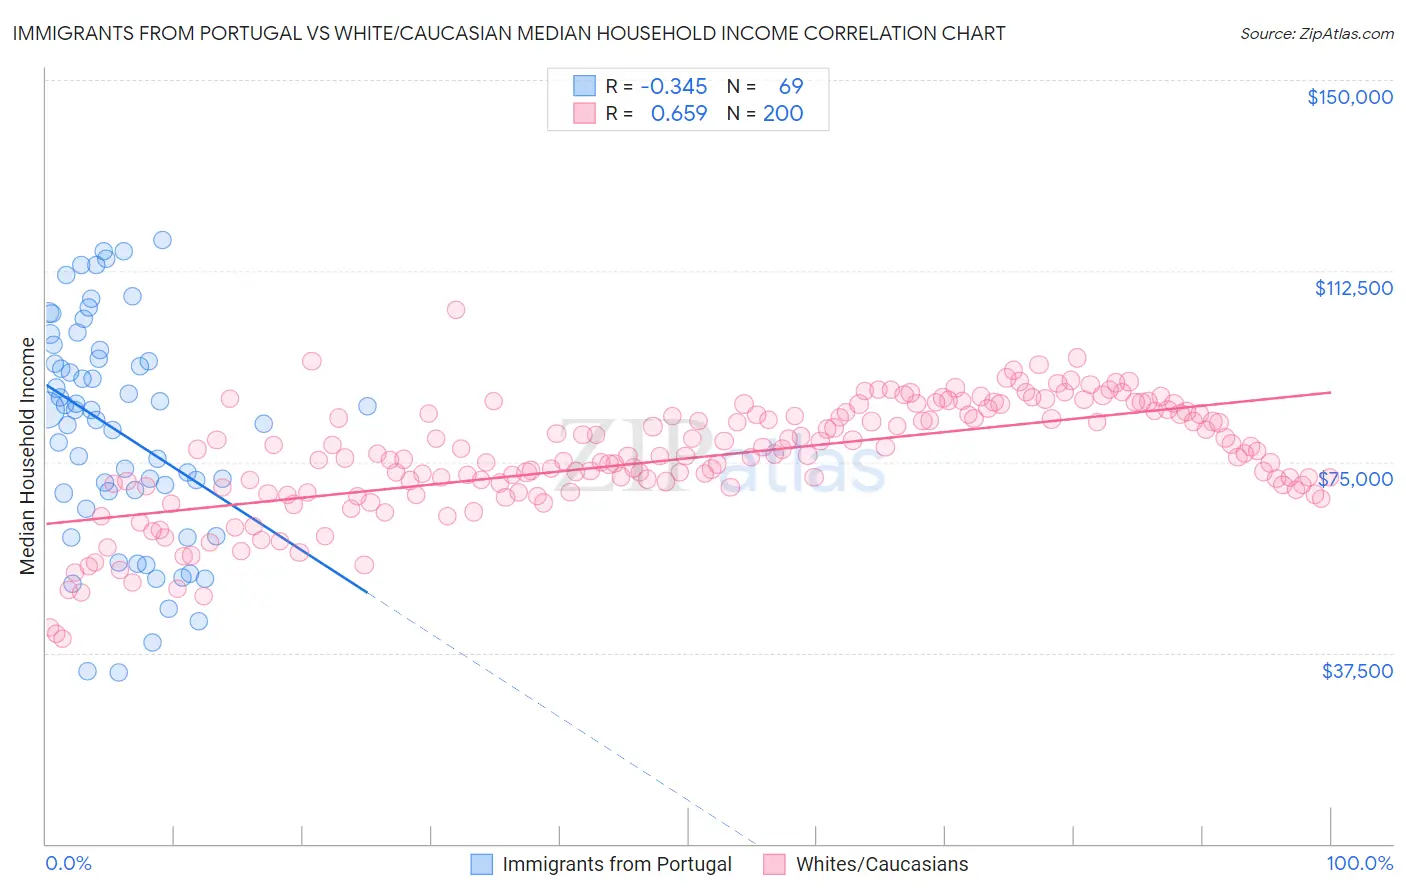
Immigrants from Portugal vs White/Caucasian Median Household Income Correlation Chart
The statistical analysis conducted on geographies consisting of 174,758,543 people shows a mild negative correlation between the proportion of Immigrants from Portugal and median household income in the United States with a correlation coefficient (R) of -0.345 and weighted average of $84,740. Similarly, the statistical analysis conducted on geographies consisting of 583,274,044 people shows a significant positive correlation between the proportion of Whites/Caucasians and median household income in the United States with a correlation coefficient (R) of 0.659 and weighted average of $82,029, a difference of 3.3%.
Median Household Income Correlation Summary
| Measurement | Immigrants from Portugal | White/Caucasian |
| Minimum | $33,750 | $40,196 |
| Maximum | $118,667 | $104,886 |
| Range | $84,917 | $64,690 |
| Mean | $80,926 | $75,721 |
| Median | $85,116 | $76,251 |
| Interquartile 25% (IQ1) | $67,289 | $70,055 |
| Interquartile 75% (IQ3) | $96,142 | $84,369 |
| Interquartile Range (IQR) | $28,853 | $14,314 |
| Standard Deviation (Sample) | $21,750 | $11,326 |
| Standard Deviation (Population) | $21,592 | $11,297 |
Similar Demographics by Median Household Income
Demographics Similar to Immigrants from Portugal by Median Household Income
In terms of median household income, the demographic groups most similar to Immigrants from Portugal are Hawaiian ($84,729, a difference of 0.010%), Uruguayan ($84,691, a difference of 0.060%), Spaniard ($84,644, a difference of 0.11%), English ($84,915, a difference of 0.21%), and Czechoslovakian ($84,965, a difference of 0.27%).
| Demographics | Rating | Rank | Median Household Income |
| Immigrants | Cameroon | 53.4 /100 | #173 | Average $85,314 |
| Scottish | 50.0 /100 | #174 | Average $85,101 |
| Immigrants | Costa Rica | 49.2 /100 | #175 | Average $85,054 |
| Alsatians | 49.2 /100 | #176 | Average $85,053 |
| Immigrants | Eritrea | 48.8 /100 | #177 | Average $85,025 |
| Czechoslovakians | 47.8 /100 | #178 | Average $84,965 |
| English | 47.0 /100 | #179 | Average $84,915 |
| Immigrants | Portugal | 44.2 /100 | #180 | Average $84,740 |
| Hawaiians | 44.1 /100 | #181 | Average $84,729 |
| Uruguayans | 43.5 /100 | #182 | Average $84,691 |
| Spaniards | 42.7 /100 | #183 | Average $84,644 |
| Immigrants | Eastern Africa | 37.4 /100 | #184 | Fair $84,299 |
| Kenyans | 34.2 /100 | #185 | Fair $84,085 |
| Puget Sound Salish | 33.2 /100 | #186 | Fair $84,011 |
| Belgians | 33.2 /100 | #187 | Fair $84,008 |
Demographics Similar to Whites/Caucasians by Median Household Income
In terms of median household income, the demographic groups most similar to Whites/Caucasians are Ecuadorian ($82,070, a difference of 0.050%), Yugoslavian ($82,186, a difference of 0.19%), Vietnamese ($82,248, a difference of 0.27%), Panamanian ($82,272, a difference of 0.30%), and Nigerian ($81,725, a difference of 0.37%).
| Demographics | Rating | Rank | Median Household Income |
| Salvadorans | 15.4 /100 | #211 | Poor $82,449 |
| Venezuelans | 15.3 /100 | #212 | Poor $82,432 |
| Nepalese | 15.1 /100 | #213 | Poor $82,410 |
| Panamanians | 14.0 /100 | #214 | Poor $82,272 |
| Vietnamese | 13.8 /100 | #215 | Poor $82,248 |
| Yugoslavians | 13.3 /100 | #216 | Poor $82,186 |
| Ecuadorians | 12.5 /100 | #217 | Poor $82,070 |
| Whites/Caucasians | 12.2 /100 | #218 | Poor $82,029 |
| Nigerians | 10.3 /100 | #219 | Poor $81,725 |
| Immigrants | Venezuela | 9.0 /100 | #220 | Tragic $81,506 |
| Immigrants | Ghana | 9.0 /100 | #221 | Tragic $81,489 |
| Immigrants | Nigeria | 7.7 /100 | #222 | Tragic $81,236 |
| Immigrants | El Salvador | 7.6 /100 | #223 | Tragic $81,213 |
| Malaysians | 7.0 /100 | #224 | Tragic $81,064 |
| Scotch-Irish | 6.6 /100 | #225 | Tragic $80,972 |