Immigrants from Thailand vs White/Caucasian Median Household Income
COMPARE
Immigrants from Thailand
White/Caucasian
Median Household Income
Median Household Income Comparison
Immigrants from Thailand
Whites/Caucasians
$83,327
MEDIAN HOUSEHOLD INCOME
24.3/ 100
METRIC RATING
202nd/ 347
METRIC RANK
$82,029
MEDIAN HOUSEHOLD INCOME
12.2/ 100
METRIC RATING
218th/ 347
METRIC RANK
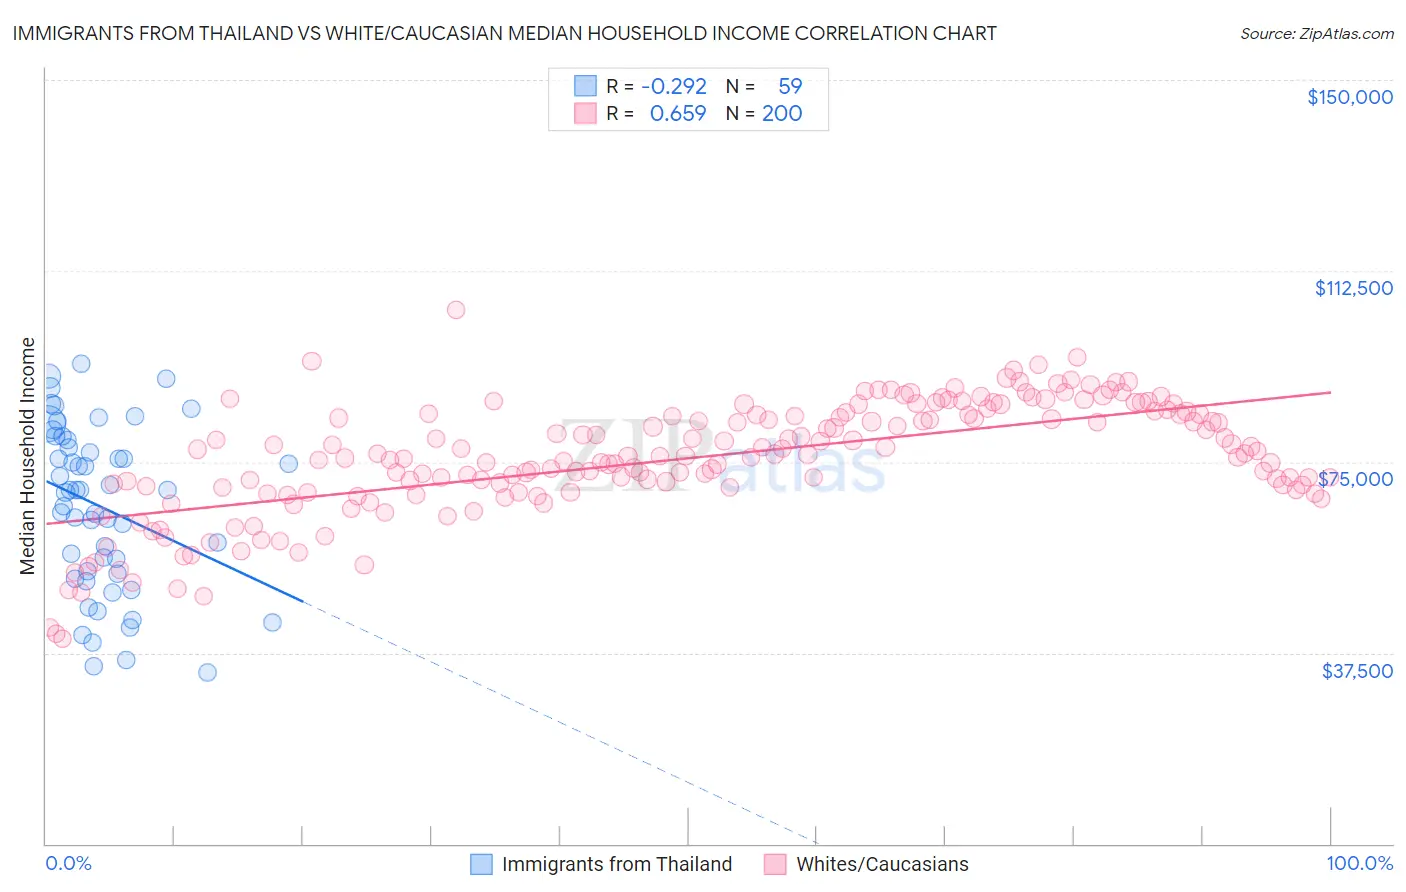
Immigrants from Thailand vs White/Caucasian Median Household Income Correlation Chart
The statistical analysis conducted on geographies consisting of 316,905,677 people shows a weak negative correlation between the proportion of Immigrants from Thailand and median household income in the United States with a correlation coefficient (R) of -0.292 and weighted average of $83,327. Similarly, the statistical analysis conducted on geographies consisting of 583,274,044 people shows a significant positive correlation between the proportion of Whites/Caucasians and median household income in the United States with a correlation coefficient (R) of 0.659 and weighted average of $82,029, a difference of 1.6%.
Median Household Income Correlation Summary
| Measurement | Immigrants from Thailand | White/Caucasian |
| Minimum | $33,750 | $40,196 |
| Maximum | $94,169 | $104,886 |
| Range | $60,419 | $64,690 |
| Mean | $66,115 | $75,721 |
| Median | $69,375 | $76,251 |
| Interquartile 25% (IQ1) | $53,069 | $70,055 |
| Interquartile 75% (IQ3) | $79,311 | $84,369 |
| Interquartile Range (IQR) | $26,242 | $14,314 |
| Standard Deviation (Sample) | $16,097 | $11,326 |
| Standard Deviation (Population) | $15,960 | $11,297 |
Demographics Similar to Immigrants from Thailand and Whites/Caucasians by Median Household Income
In terms of median household income, the demographic groups most similar to Immigrants from Thailand are Tsimshian ($83,346, a difference of 0.020%), Spanish ($83,343, a difference of 0.020%), Immigrants from Cambodia ($83,304, a difference of 0.030%), Immigrants from Africa ($83,289, a difference of 0.050%), and Celtic ($83,193, a difference of 0.16%). Similarly, the demographic groups most similar to Whites/Caucasians are Ecuadorian ($82,070, a difference of 0.050%), Yugoslavian ($82,186, a difference of 0.19%), Vietnamese ($82,248, a difference of 0.27%), Panamanian ($82,272, a difference of 0.30%), and Nigerian ($81,725, a difference of 0.37%).
| Demographics | Rating | Rank | Median Household Income |
| Tsimshian | 24.5 /100 | #200 | Fair $83,346 |
| Spanish | 24.4 /100 | #201 | Fair $83,343 |
| Immigrants | Thailand | 24.3 /100 | #202 | Fair $83,327 |
| Immigrants | Cambodia | 24.0 /100 | #203 | Fair $83,304 |
| Immigrants | Africa | 23.8 /100 | #204 | Fair $83,289 |
| Celtics | 22.7 /100 | #205 | Fair $83,193 |
| Immigrants | Kenya | 21.3 /100 | #206 | Fair $83,068 |
| Dutch | 20.3 /100 | #207 | Fair $82,971 |
| French Canadians | 18.7 /100 | #208 | Poor $82,810 |
| Immigrants | Iraq | 16.7 /100 | #209 | Poor $82,594 |
| Immigrants | Uruguay | 16.4 /100 | #210 | Poor $82,560 |
| Salvadorans | 15.4 /100 | #211 | Poor $82,449 |
| Venezuelans | 15.3 /100 | #212 | Poor $82,432 |
| Nepalese | 15.1 /100 | #213 | Poor $82,410 |
| Panamanians | 14.0 /100 | #214 | Poor $82,272 |
| Vietnamese | 13.8 /100 | #215 | Poor $82,248 |
| Yugoslavians | 13.3 /100 | #216 | Poor $82,186 |
| Ecuadorians | 12.5 /100 | #217 | Poor $82,070 |
| Whites/Caucasians | 12.2 /100 | #218 | Poor $82,029 |
| Nigerians | 10.3 /100 | #219 | Poor $81,725 |
| Immigrants | Venezuela | 9.0 /100 | #220 | Tragic $81,506 |